Matplotlib是Python中的一個庫,它是數字的-NumPy庫的數學擴展。軸類包含大多數圖形元素:Axis,Tick,Line2D,Text,Polygon等,並設置坐標係。 Axes實例通過callbacks屬性支持回調。
matplotlib.axes.Axes.set_alpha()函數
matplotlib庫的axiss模塊中的Axes.set_alpha()函數用於設置用於混合的alpha值。
用法: Axes.set_alpha(self, alpha)
參數:此方法僅接受一個參數。
- alpha:此參數是包含浮點值或無。
返回值:此方法不返回任何值。
以下示例說明了matplotlib.axes中的matplotlib.axes.Axes.set_alpha()函數:
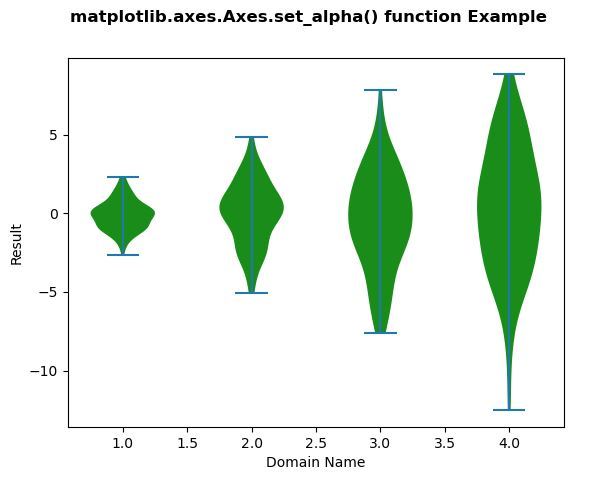
範例1:
# Implementation of matplotlib function
import matplotlib.pyplot as plt
import numpy as np

# create test data
np.random.seed(10**7)
data = [sorted(np.random.normal(0, std, 100))
       for std in range(1, 5)]

fig, ax1 = plt.subplots()
val = ax1.violinplot(data)
ax1.set_ylabel('Result')
ax1.set_xlabel('Domain Name')
for i in val['bodies']:
    i.set_facecolor('green')
    i.set_alpha(0.9)

fig.suptitle('matplotlib.axes.Axes.set_alpha() \
function Example\n\n', fontweight ="bold")

plt.show()
輸出:
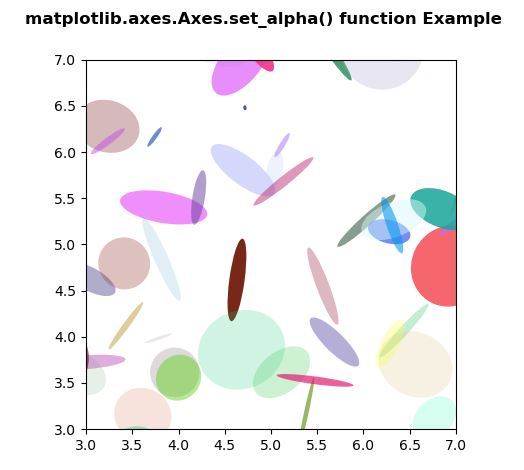
範例2:
# Implementation of matplotlib function
import matplotlib.pyplot as plt
import numpy as np
from matplotlib.patches import Ellipse

NUM = 200

ells = [Ellipse(xy = np.random.rand(2) * 10,
                width = np.random.rand(),
                height = np.random.rand(),
                angle = np.random.rand() * 360)
        for i in range(NUM)]

fig, ax = plt.subplots(subplot_kw ={'aspect':'equal'})

for e in ells:
    ax.add_artist(e)
    e.set_clip_box(ax.bbox)
    e.set_alpha(np.random.rand())
    e.set_facecolor(np.random.rand(4))

ax.set_xlim(3, 7)
ax.set_ylim(3, 7)


fig.suptitle('matplotlib.axes.Axes.set_alpha()\
 function Example\n\n', fontweight ="bold")

plt.show()
輸出:
相關用法
注:本文由純淨天空篩選整理自SHUBHAMSINGH10大神的英文原創作品 Matplotlib.axes.Axes.set_alpha() in Python。非經特殊聲明,原始代碼版權歸原作者所有,本譯文未經允許或授權,請勿轉載或複製。