Matplotlib是Python中的一個庫,它是NumPy庫的數學擴展-Axes類包含大多數圖形元素:Axis,Tick,Line2D,Text,Polygon等,並設置坐標係。 Axes實例通過callbacks屬性支持回調。
matplotlib.axes.Axes.semilogy()函數
matplotlib庫的axiss模塊中的Axes.semilogy()函數用於繪製在y軸上具有對數刻度的圖。
用法:
Axes.semilogy(self, *args, **kwargs)
參數:此方法接受以下描述的參數:
- basey:此參數是y對數的底,並且是可選參數,默認值為10。
- subsy:此參數是次要Y刻度的位置順序,並且是可選的。
- nonposy:此參數是y中的一個非正值,可以將其屏蔽為無效值,或裁剪為非常小的正數。
返回值:這將返回以下內容:
- 行數:這將返回代表繪製數據的Line2D對象的列表。
以下示例說明了matplotlib.axes中的matplotlib.axes.Axes.semilogy()函數:
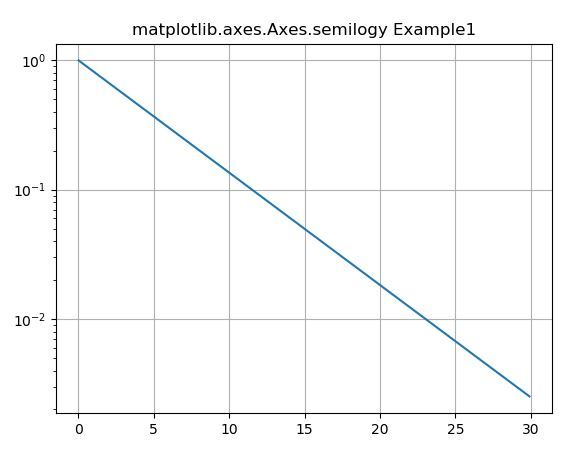
示例1:
# Implementation of matplotlib function

import numpy as np
import matplotlib.pyplot as plt

test = np.arange(0.01, 30.0, 0.1)

# Create figure
fig, ax = plt.subplots()


# log x axis
ax.semilogy(test, np.exp(-test / 5.0))
ax.grid()


ax.set_title('matplotlib.axes.Axes.semilogy Example1')
plt.show()
輸出:
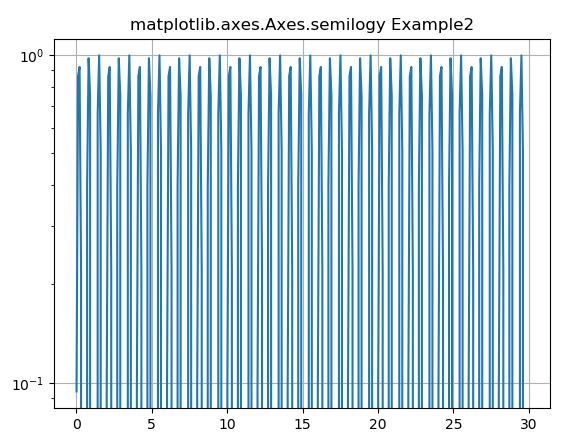
示例2:
# Implementation of matplotlib function

import numpy as np
import matplotlib.pyplot as plt

test = np.arange(0.01, 30.0, 0.1)

# Create figure
fig, ax = plt.subplots()


# log x axis
ax.semilogy(test, np.sin(3 * np.pi * test))
ax.grid()


ax.set_title('matplotlib.axes.Axes.semilogy Example2')
plt.show()
輸出:
相關用法
注:本文由純淨天空篩選整理自SHUBHAMSINGH10大神的英文原創作品 Matplotlib.axes.Axes.semilogy() in Python。非經特殊聲明,原始代碼版權歸原作者所有,本譯文未經允許或授權,請勿轉載或複製。