Matplotlib是Python中的一個庫,它是數字的-NumPy庫的數學擴展。軸類包含大多數圖形元素:Axis,Tick,Line2D,Text,Polygon等,並設置坐標係。 Axes實例通過callbacks屬性支持回調。
matplotlib.axes.Axes.remove_callback()方法
matplotlib庫的axes模塊中的remove_callback()方法用於根據其觀察者ID刪除回調。
用法:Axes.remove_callback(self, oid)
參數:此方法接受以下參數。
- oid:此參數是觀察者ID
返回值:此方法不返回任何值,
以下示例說明了matplotlib中的matplotlib.axes.Axes.add_callback()函數:
範例1:
# Implementation of matplotlib function
import matplotlib.pyplot as plt
import numpy as np
import time


def update():
    plt.get_current_fig_manager().canvas.figure.patch.set_facecolor(str(np.random.random()))
    plt.draw()
    print("Draw at time:", time.time())


def start_animation():

    timer = fig.canvas.new_timer(interval = 50)
    w = timer.add_callback(update)
    timer.start()
    timer.remove_callback(w)

fig, ax = plt.subplots()
start_animation()

ax.set_title('matplotlib.axes.Axes.remove_callback() \
function Example', fontweight ="bold")

plt.show()
輸出:

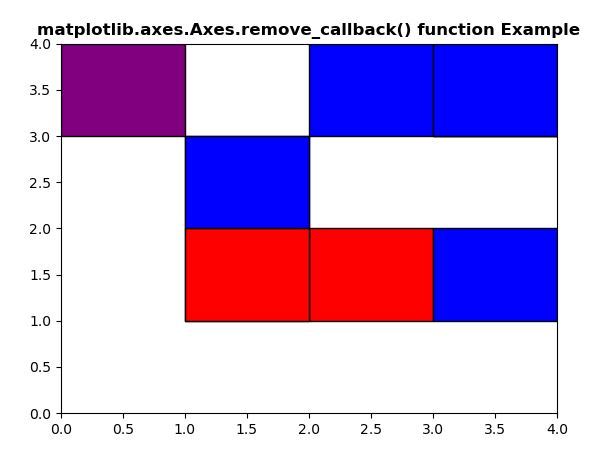
範例2:
# Implementation of matplotlib function
from random import randint, choice
import time
import matplotlib.pyplot as plt
import matplotlib.patches as mpatches


back_color = "black"
colors = ['red', 'green', 'blue', 'purple']
width, height = 4, 4

fig, ax = plt.subplots()
ax.set(xlim =[0, width], ylim =[0, height])

fig.canvas.draw()
ll = 1

def update():
    global ll
    x = randint(0, width - 1)
    y = randint(0, height - 1)

    arti = mpatches.Rectangle(
        (x, y), 1, 1,
        facecolor = choice(colors),
        edgecolor = back_color
    )

    ax.add_artist(arti)

    ax.draw_artist(arti)

    fig.canvas.blit(ax.bbox)
    print("Draw at time:", time.time())

    if ll > 10:
        timer.remove_callback(w)
    ll += 1

timer = fig.canvas.new_timer(interval = 1)
w = timer.add_callback(update)
timer.start()

ax.set_title('matplotlib.axes.Axes.remove_callback()\
function Example', fontweight ="bold")

plt.show()
輸出:
Draw at time:1588597900.000635
Draw at time:1588597900.047566
Draw at time:1588597900.0787704
Draw at time:1588597900.11001
Draw at time:1588597900.1412835
Draw at time:1588597900.1725228
Draw at time:1588597900.2037697
Draw at time:1588597900.2350247
Draw at time:1588597900.2662778
Draw at time:1588597900.2975273
Draw at time:1588597900.313137
注:本文由純淨天空篩選整理自SHUBHAMSINGH10大神的英文原創作品 Matplotlib.axes.Axes.remove_callback() in Python。非經特殊聲明,原始代碼版權歸原作者所有,本譯文未經允許或授權,請勿轉載或複製。