Matplotlib是Python中的一個庫,它是數字的-NumPy庫的數學擴展。軸類包含大多數圖形元素:Axis,Tick,Line2D,Text,Polygon等,並設置坐標係。 Axes實例通過callbacks屬性支持回調。
matplotlib.axes.Axes.minorticks_on()函數
matplotlib庫的軸模塊中的Axes.minorticks_on()函數用於在軸上顯示次刻度。
用法:
Axes.minorticks_on(self)
以下示例說明了matplotlib.axes中的matplotlib.axes.Axes.minorticks_on()函數:
範例1:
# Implementation of matplotlib function
import numpy as np
import matplotlib.pyplot as plt
import matplotlib.cbook as cbook
import matplotlib.cm as cm
from matplotlib.collections import LineCollection
from matplotlib.ticker import MultipleLocator
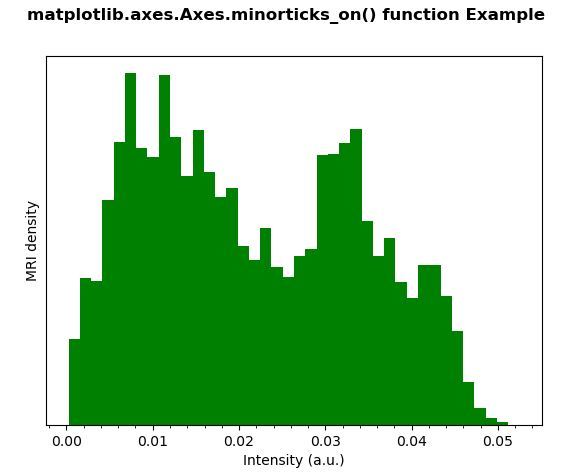
with cbook.get_sample_data('s1045.ima.gz') as dfile:
im = np.frombuffer(dfile.read(),
np.uint16).reshape((256, 256))
fig, ax1 = plt.subplots()
im = np.ravel(im)
im = im[np.nonzero(im)]
im = im / (2**20 - 1)
ax1.hist(im, bins = 40, color ="green")
ax1.set_yticks([])
ax1.set_xlabel('Intensity (a.u.)')
ax1.set_ylabel('MRI density')
ax1.minorticks_on()
fig.suptitle('matplotlib.axes.Axes.minorticks_on() \
function Example\n\n', fontweight ="bold")
plt.show()輸出:
範例2:
# Implementation of matplotlib function
import matplotlib.pyplot as plt
import numpy as np
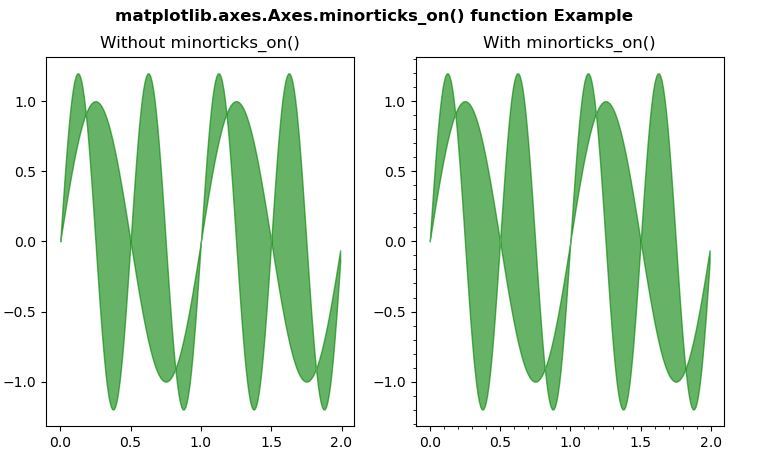
x = np.arange(0.0, 2, 0.01)
y1 = np.sin(2 * np.pi * x)
y2 = 1.2 * np.sin(4 * np.pi * x)
fig, (ax, ax1) = plt.subplots(1, 2)
ax.fill_between(x, y1, y2, color ="green",
alpha = 0.6)
ax.set_title("Without minorticks_on()")
ax1.fill_between(x, y1, y2, color ="green",
alpha = 0.6)
ax1.minorticks_on()
ax1.set_title("With minorticks_on()")
fig.suptitle('matplotlib.axes.Axes.minorticks_on()\
function Example\n\n', fontweight ="bold")
plt.show()輸出:
相關用法
注:本文由純淨天空篩選整理自SHUBHAMSINGH10大神的英文原創作品 Matplotlib.axes.Axes.minorticks_on() in Python。非經特殊聲明,原始代碼版權歸原作者所有,本譯文未經允許或授權,請勿轉載或複製。