Matplotlib是Python中的一個庫,它是數字的-NumPy庫的數學擴展。軸類包含大多數圖形元素:Axis,Tick,Line2D,Text,Polygon等,並設置坐標係。 Axes實例通過callbacks屬性支持回調。
matplotlib.axes.Axes.locator_params()函數
matplotlib庫的axiss模塊中的Axes.locator_params()函數用於控製主要刻度定位器的行為。
用法: Axes.locator_params(self, axis=’both’, tight=None, **kwargs)
參數:此方法接受以下參數。
- axis:該參數是要運行的軸
- tight:此參數傳遞給autoscale_view。默認為無,不做任何更改。
。
返回值:此方法不返回任何值。
以下示例說明了matplotlib.axes.Axes.locator_params()matplotlib.axes中的函數:
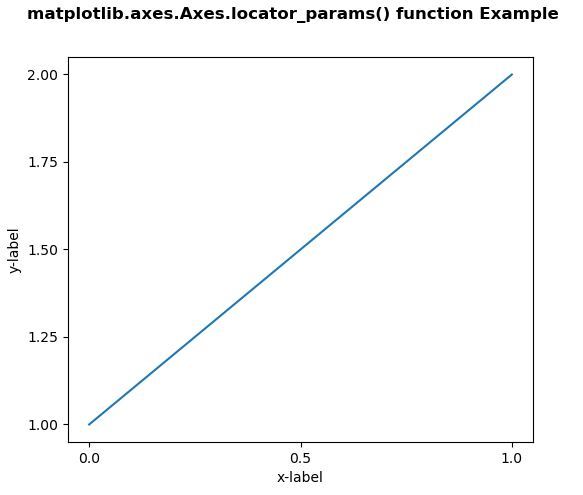
範例1:
# Implementation of matplotlib function
import matplotlib.pyplot as plt
import matplotlib.colors as mcolors
import matplotlib.gridspec as gridspec
import numpy as np


plt.rcParams['savefig.facecolor'] = "0.8"
plt.rcParams['figure.figsize'] = 6, 5

fig, ax = plt.subplots()

ax.plot([1, 2])

ax.locator_params("x", nbins = 3)
ax.locator_params("y", nbins = 5)

ax.set_xlabel('x-label')
ax.set_ylabel('y-label')

fig.suptitle('matplotlib.axes.Axes.locator_params() \
function Example\n\n', fontweight ="bold")
plt.show()
輸出:
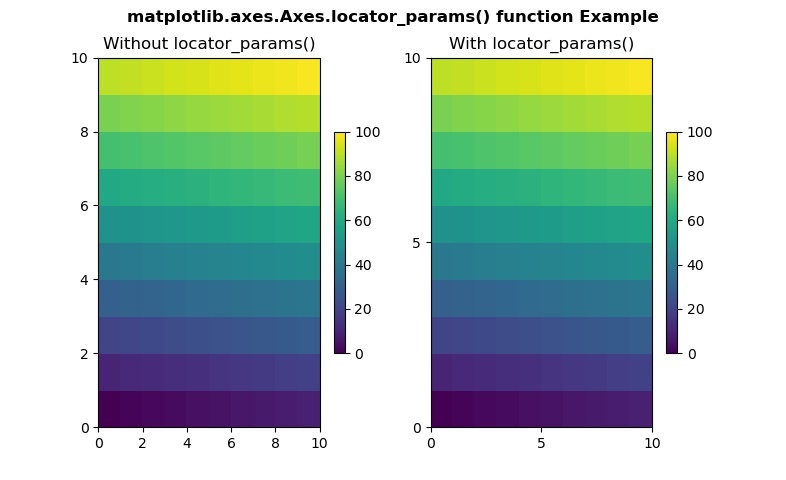
範例2:
# Implementation of matplotlib function
import matplotlib.pyplot as plt
import matplotlib.colors as mcolors
import matplotlib.gridspec as gridspec
import numpy as np


arr = np.arange(100).reshape((10, 10))
norm = mcolors.Normalize(vmin = 0., vmax = 100.)

pc_kwargs = {'rasterized':True, 'cmap':'viridis',
             'norm':norm}

fig, (ax, ax1) = plt.subplots(1, 2)

im = ax.pcolormesh(arr, **pc_kwargs)
fig.colorbar(im, ax = ax, shrink = 0.6)

im1 = ax1.pcolormesh(arr, **pc_kwargs)
ax1.locator_params(nbins = 3)
fig.colorbar(im1, ax = ax1, shrink = 0.6)

ax.set_title("Without locator_params()")
ax1.set_title("With locator_params()")

fig.suptitle('matplotlib.axes.Axes.locator_params() \
function Example\n\n', fontweight ="bold")
plt.show()
輸出:
相關用法
注:本文由純淨天空篩選整理自SHUBHAMSINGH10大神的英文原創作品 Matplotlib.axes.Axes.locator_params() in Python。非經特殊聲明,原始代碼版權歸原作者所有,本譯文未經允許或授權,請勿轉載或複製。