Matplotlib是Python中的一個庫,它是數字的-NumPy庫的數學擴展。軸類包含大多數圖形元素:Axis,Tick,Line2D,Text,Polygon等,並設置坐標係。 Axes實例通過callbacks屬性支持回調。
matplotlib.axes.Axes.hlines()函數
matplotlib庫的axiss模塊中的Axes.hlines()函數用於繪製從xmin到xmax的每個y處的垂直線。
用法: Axes.hlines(self, y, xmin, xmax, colors=’k’, linestyles=’solid’, label=”, *, data=None, **kwargs)
參數:此方法接受以下描述的參數:
- y:該參數是y-indexes繪製線條的順序。
- xmin, xmax:這些參數包含一個數組,它們代表每行的開頭和結尾。
- colors:此參數是可選參數。它是默認值為k的線條的顏色。
- linetsyle:此參數也是可選參數。它用於表示線型{'實線','虛線','虛線','虛線'}。
- label:該參數也是可選參數,它是圖形的標簽。
返回值:這將返回LineCollection。
以下示例說明了matplotlib.axes中的matplotlib.axes.Axes.hlines()函數:
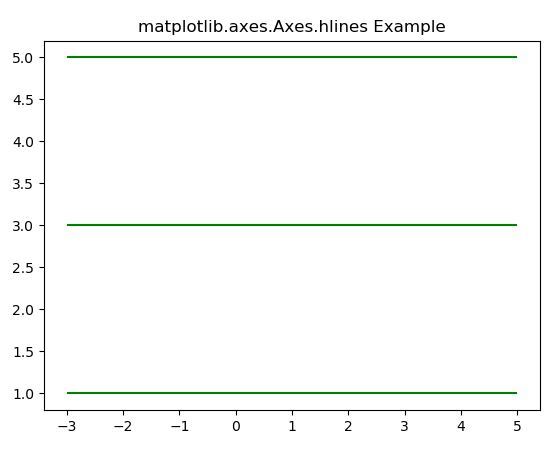
範例1:
# Implementation of matplotlib function

import numpy as np
from matplotlib import patches
import matplotlib.pyplot as plt

fig, ax = plt.subplots()
ax.hlines([1, 3, 5], -3, 5, color ="green")
ax.set_title('matplotlib.axes.Axes.hlines Example')

plt.show()
輸出:
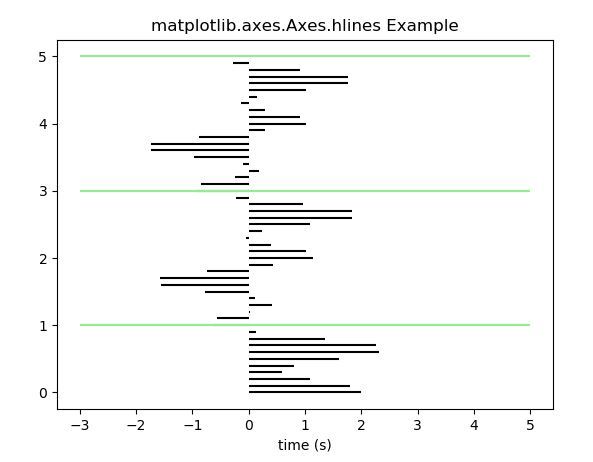
範例2:
# Implementation of matplotlib function

import numpy as np
from matplotlib import patches
import matplotlib.pyplot as plt

t = np.arange(0.0, 5.0, 0.1)
s = np.exp(-t) + np.cos(3 * np.pi * t) + np.sin(np.pi * t)
nse = np.random.normal(0.0, 0.8, t.shape) * s

fig, ax = plt.subplots()

ax.hlines(t, [0], s)
ax.set_xlabel('time (s)')
ax.hlines([1, 3, 5], -3, 5, color ="lightgreen")
ax.set_title('matplotlib.axes.Axes.hlines Example')

plt.show()
輸出:
相關用法
注:本文由純淨天空篩選整理自SHUBHAMSINGH10大神的英文原創作品 Matplotlib.axes.Axes.hlines() in Python。非經特殊聲明,原始代碼版權歸原作者所有,本譯文未經允許或授權,請勿轉載或複製。