Matplotlib是Python中的一個庫,它是數字的-NumPy庫的數學擴展。軸類包含大多數圖形元素:Axis,Tick,Line2D,Text,Polygon等,並設置坐標係。 Axes實例通過callbacks屬性支持回調。
matplotlib.axes.Axes.get_yscale()函數
matplotlib庫的axiss模塊中的Axes.get_yscale()函數用於獲取y軸刻度作為字符串。
用法: Axes.get_yscale(self)
參數:此方法不接受任何參數。
返回:此函數以字符串形式返回y軸刻度。
以下示例說明了matplotlib.axes中的matplotlib.axes.Axes.get_yscale()函數:
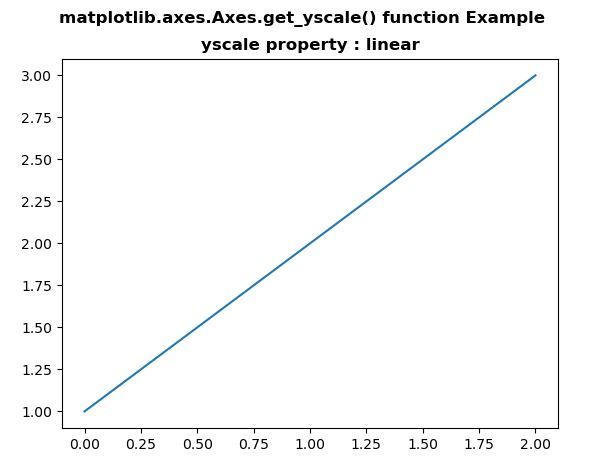
範例1:
# Implementation of matplotlib function
import matplotlib.pyplot as plt
import numpy as np

fig, ax = plt.subplots()

ax.plot([1, 2, 3])

w = ax.get_yscale()

ax.set_title("yscale property:"+ str(w),
             fontweight ="bold")
fig.suptitle('matplotlib.axes.Axes.get_yscale() \
function Example\n', fontweight ="bold")
fig.canvas.draw()
plt.show()
輸出:
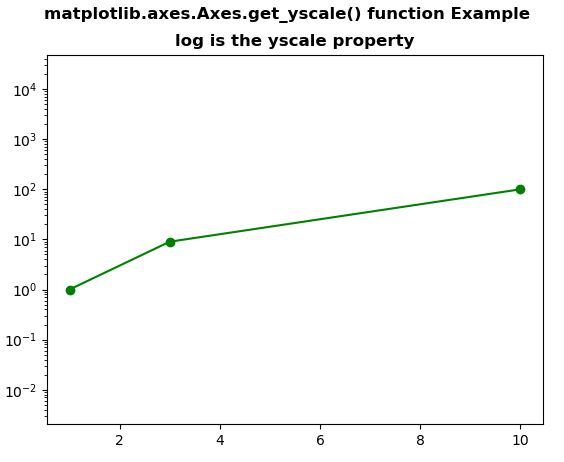
範例2:
# Implementation of matplotlib function
import matplotlib.pyplot as plt

fig, ax = plt.subplots()

ax.set_yscale("log")
ax.set_adjustable("datalim")
ax.plot([1, 3, 10], [1, 9, 100], "o-", color ="green")
ax.set_ylim(1e-1, 1e3)
ax.set_aspect(1)
w = ax.get_yscale()
ax.set_title(str(w)+" is the yscale property",
             fontweight ="bold")
fig.suptitle('matplotlib.axes.Axes.get_yscale()\
 function Example\n', fontweight ="bold")

plt.show()
輸出:
相關用法
注:本文由純淨天空篩選整理自SHUBHAMSINGH10大神的英文原創作品 Matplotlib.axes.Axes.get_yscale() in Python。非經特殊聲明,原始代碼版權歸原作者所有,本譯文未經允許或授權,請勿轉載或複製。