Matplotlib是Python中的一個庫,它是數字的-NumPy庫的數學擴展。軸類包含大多數圖形元素:Axis,Tick,Line2D,Text,Polygon等,並設置坐標係。 Axes實例通過callbacks屬性支持回調。
matplotlib.axes.Axes.get_ygridlines()函數
matplotlib庫的axiss模塊中的Axes.get_ygridlines()函數用於將y網格線作為Line2D實例的列表返回。
用法: Axes.get_ygridlines(self)
參數:此方法不接受任何參數。
返回值:此方法返回y網格線作為Line2D實例的列表。
以下示例說明了matplotlib.axes中的matplotlib.axes.Axes.get_ygridlines()函數:
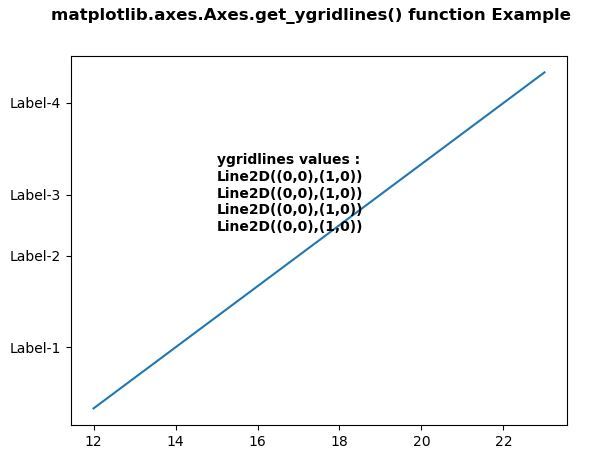
範例1:
# Implementation of matplotlib function
import matplotlib.pyplot as plt
import matplotlib.transforms as mtransforms


fig, ax = plt.subplots()
ax.plot(range(12, 24), range(12))
ax.set_yticks((2, 5, 7, 10))
ax.set_yticklabels(("Label-1", "Label-2",
                    "Label-3", "Label-4"))

w = ax.get_ygridlines()
ax.text(15, 8, "ygridlines values:",
       fontweight ="bold")
xx = 8
for i in w:
    ax.text(15, xx-0.55, str(i),
           fontweight ="bold")
    xx-= 0.55

fig.suptitle('matplotlib.axes.Axes.get_ygridlines()\
 function Example\n\n', fontweight ="bold")
plt.show()
輸出:
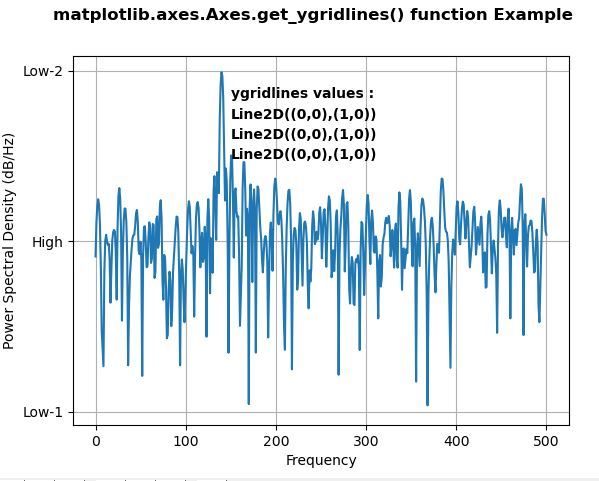
範例2:
# Implementation of matplotlib function
import matplotlib.pyplot as plt
import numpy as np
import matplotlib.mlab as mlab
import matplotlib.gridspec as gridspec


fs = 1000
t = np.linspace(0, 0.3, 301)
A = np.array([2, 8]).reshape(-1, 1)
f = np.array([150, 140]).reshape(-1, 1)
xn = (A * np.sin(2 * np.pi * f * t)).sum(axis = 0)
xn += 5 * np.random.randn(*t.shape)

fig, ax = plt.subplots()

yticks = [-40, -15, 10]

ax.psd(xn, NFFT = 301, Fs = fs,
      window = mlab.window_none,
      pad_to = 1024,
      scale_by_freq = True)

ax.set_yticks(yticks)
ax.set_yticklabels(("Low-1", "High", "Low-2"))
ax.grid(True)

w = ax.get_ygridlines()
ax.text(150, 6, "ygridlines values:",
        fontweight ="bold")
xx = 6
for i in w:
    ax.text(150, xx-3, str(i), fontweight ="bold")
    xx-= 3

fig.suptitle('matplotlib.axes.Axes.get_ygridlines()\
 function Example\n\n', fontweight ="bold")
plt.show()
輸出:
相關用法
注:本文由純淨天空篩選整理自SHUBHAMSINGH10大神的英文原創作品 Matplotlib.axes.Axes.get_ygridlines() in Python。非經特殊聲明,原始代碼版權歸原作者所有,本譯文未經允許或授權,請勿轉載或複製。