Matplotlib是Python中的一個庫,它是數字的-NumPy庫的數學擴展。軸類包含大多數圖形元素:Axis,Tick,Line2D,Text,Polygon等,並設置坐標係。 Axes實例通過callbacks屬性支持回調。
matplotlib.axes.Axes.get_xaxis_transform()函數
matplotlib庫的axiss模塊中的Axes.get_xaxis_transform()函數用於獲取用於繪製x軸標簽,刻度線和網格線的轉換。
用法: Axes.get_xaxis_transform(self, which=’grid’)
參數:此方法不接受任何參數。
返回值:此方法返回用於繪製x軸標簽,刻度線和網格線的轉換。
以下示例說明了matplotlib.axes中的matplotlib.axes.Axes.get_xaxis_transform()函數:
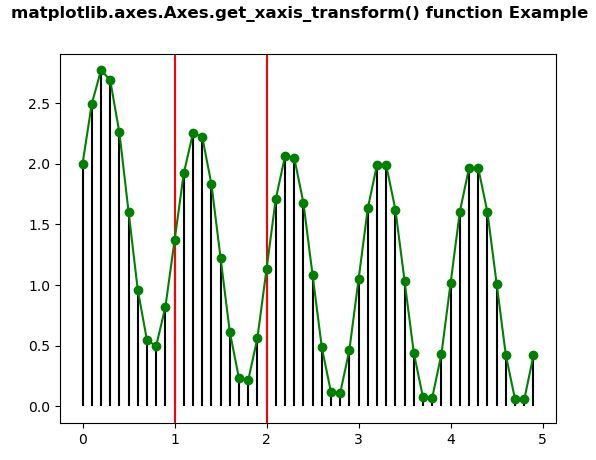
範例1:
# Implementation of matplotlib function
import matplotlib.pyplot as plt
import numpy as np


t = np.arange(0.0, 5.0, 0.1)
s = np.exp(-t) + np.sin(2 * np.pi * t) + 1
nse = np.random.normal(0.0, 0.3, t.shape) * s

fig, vax = plt.subplots()

vax.plot(t, s, 'go-')
vax.vlines(t, [0], s)
vax.vlines([1, 2], 0, 1,
           transform = vax.get_xaxis_transform(),
           colors ='r')

fig.suptitle('matplotlib.axes.Axes.get_xaxis_transform()\
 function Example', fontweight ="bold")

plt.show()
輸出:
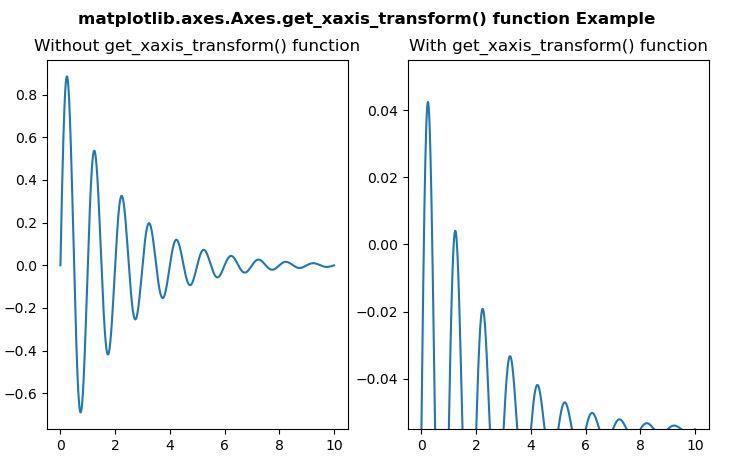
範例2:
# Implementation of matplotlib function
import numpy as np
import matplotlib.pyplot as plt
import matplotlib.patches as mpatches

x = np.arange(0, 10, 0.005)
y = np.exp(-x / 2.) * np.sin(2 * np.pi * x)

fig, [ax, ax1] = plt.subplots(1, 2)

ax.plot(x, y)
ax.set_title("Without get_xaxis_transform() function")

ax1.plot(x, y, transform = ax1.get_xaxis_transform())
ax1.set_title("With get_xaxis_transform() function")

fig.suptitle('matplotlib.axes.Axes.get_xaxis_transform()\
 function Example', fontweight ="bold")

plt.show()
輸出:
注:本文由純淨天空篩選整理自SHUBHAMSINGH10大神的英文原創作品 Matplotlib.axes.Axes.get_xaxis_transform() in Python。非經特殊聲明,原始代碼版權歸原作者所有,本譯文未經允許或授權,請勿轉載或複製。