Matplotlib是Python中的一個庫,它是數字的-NumPy庫的數學擴展。軸類包含大多數圖形元素:Axis,Tick,Line2D,Text,Polygon等,並設置坐標係。 Axes實例通過callbacks屬性支持回調。
matplotlib.axes.Axes.get_transformed_clip_path_and_affine()函數
matplotlib庫的axiss模塊中的Axes.get_transformed_clip_path_and_affine()函數用於獲取應用了其變換的非仿射部分以及其變換的其餘仿射部分的剪輯路徑。
用法: Axes.get_transformed_clip_path_and_affine(self)
參數:此方法不接受任何參數。
返回:此方法返回應用了其變換的非仿射部分和其變換的其餘仿射部分的剪輯路徑。
以下示例說明了matplotlib.axes中的matplotlib.axes.Axes.get_transformed_clip_path_and_affine()函數:
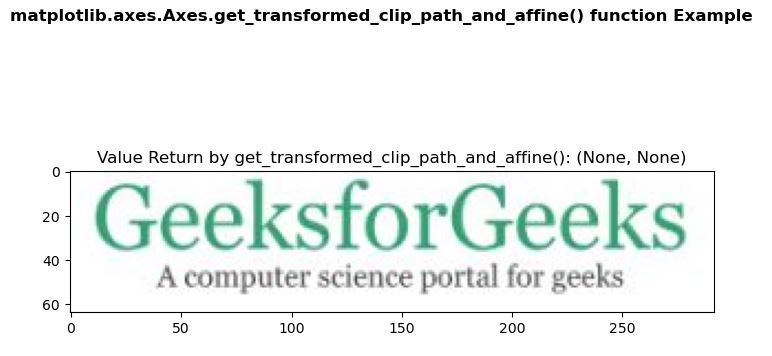
範例1:
使用的圖片:

# Implementation of matplotlib function
import matplotlib.pyplot as plt
import matplotlib.patches as patches
import matplotlib.cbook as cbook


with cbook.get_sample_data('loggf.PNG') as image_file:
    image = plt.imread(image_file)

fig, ax = plt.subplots()
im = ax.imshow(image)
patch = patches.Rectangle((0, 0), 260, 200,
                          transform = ax.transData)

ax.set_title("Value Return by get_transformed_clip_path_and_affine():"
             +str(im.get_transformed_clip_path_and_affine()))

fig.suptitle('matplotlib.axes.Axes.get_transformed_clip_path_and_affine()\
 function Example\n\n', fontweight ="bold")

plt.show()
輸出:
範例2:
# Implementation of matplotlib function
import numpy as np
import matplotlib.cm as cm
import matplotlib.pyplot as plt
from matplotlib.path import Path
from matplotlib.patches import PathPatch


delta = 0.025

x = y = np.arange(-3.0, 3.0, delta)
X, Y = np.meshgrid(x, y)

Z1 = np.exp(-X**2 - Y**2)
Z2 = np.exp(-(X - 1)**2 - (Y - 1)**2)
Z = (Z1 - Z2) * 2

path = Path([[0, 1], [1, 0], [0, -1], [-1, 0], [0, 1]])
patch = PathPatch(path, facecolor ='none')

fig, ax = plt.subplots()
ax.add_patch(patch)
im = ax.imshow(Z,
               interpolation ='bilinear',
               cmap = cm.gray,
               origin ='lower',
               extent =[-3, 3, -3, 3],
               clip_path = patch,
               clip_on = True)

print("Value Return by get_transformed_clip_path_and_affine():")

for i in im.get_transformed_clip_path_and_affine():
    print(i)

fig.suptitle('matplotlib.axes.Axes.get_transformed_clip_path_and_affine()\
 function Example\n\n', fontweight ="bold")

plt.show()
輸出:
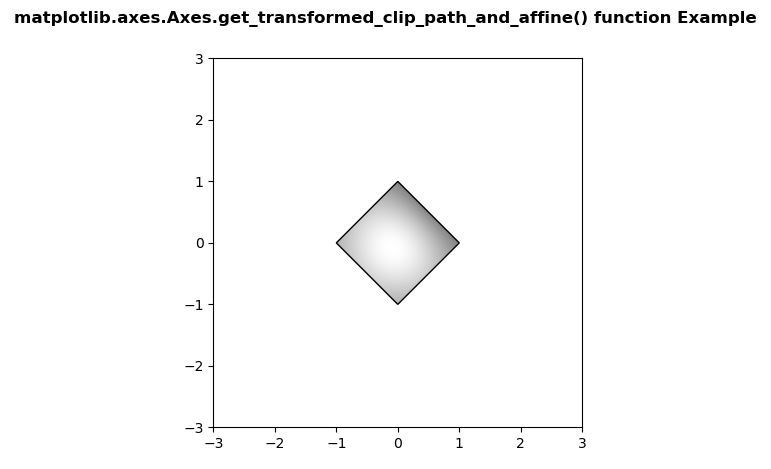
Value Return by get_transformed_clip_path_and_affine():
Path(array([[ 0.,  1.],
       [ 1.,  0.],
       [ 0., -1.],
       [-1.,  0.],
       [ 0.,  1.]]), None)
Affine2D(
    [[ 82.66666667   0.         328.        ]
     [  0.          61.6        237.6       ]
     [  0.           0.           1.        ]])
相關用法
注:本文由純淨天空篩選整理自SHUBHAMSINGH10大神的英文原創作品 Matplotlib.axes.Axes.get_transformed_clip_path_and_affine() in Python。非經特殊聲明,原始代碼版權歸原作者所有,本譯文未經允許或授權,請勿轉載或複製。