Matplotlib是Python中的一個庫,它是數字的-NumPy庫的數學擴展。軸類包含大多數圖形元素:Axis,Tick,Line2D,Text,Polygon等,並設置坐標係。 Axes實例通過callbacks屬性支持回調。
matplotlib.axes.Axes.get_tightbbox()函數
matplotlib庫的axiss模塊中的Axes.get_tightbbox()函數用於返回軸的緊密邊界框,包括軸及其裝飾器。
用法: Axes.get_tightbbox(self, renderer, call_axes_locator=True, bbox_extra_artists=None)
參數:此方法接受以下參數。
- renderer:此參數是RendererBase實例
將用於繪製圖形的渲染器。 - bbox_extra_artists:此參數是要包含在緊密邊界框中的藝術家列表。
- call_axes_locator:此參數是要包含在緊密邊界框中的藝術家列表。
返回值:此方法返回圖形像素坐標中的邊界框。
以下示例說明了matplotlib.axes中的matplotlib.axes.Axes.get_tightbbox()函數:
範例1:
# Implementation of matplotlib function
import matplotlib.pyplot as plt
import numpy as np


X = np.arange(-10, 10, 0.5)
Y = np.arange(-10, 10, 0.5)
U, V = np.meshgrid(X, Y)

fig, ax = plt.subplots()
ax.quiver(X, Y, U, V)
ax.invert_xaxis()
w = ax.get_tightbbox(fig.canvas.get_renderer(),
                     call_axes_locator = True,
                     bbox_extra_artists = None)

ax.set_title("Value Return:\n"+str(w),
              fontsize = 10)

fig.suptitle('matplotlib.axes.Axes.get_tightbbox()\
 function Example', fontweight ="bold")

plt.show()
輸出:

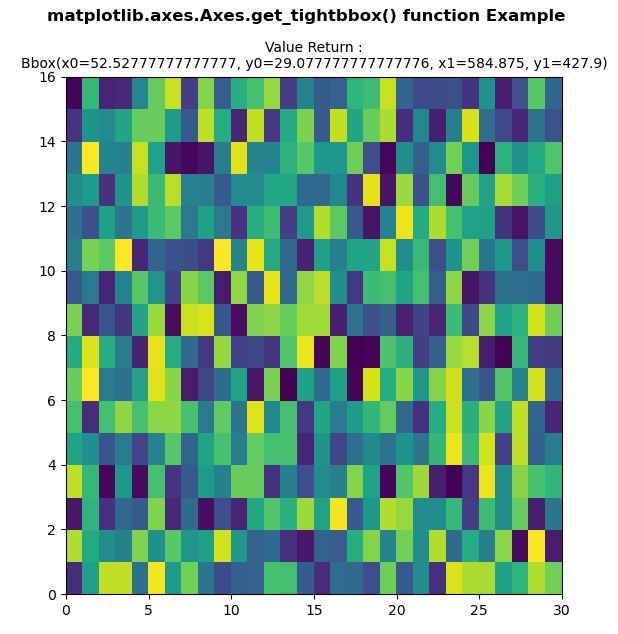
範例2:
# Implementation of matplotlib function
import numpy as np
import matplotlib.pyplot as plt

xx = np.random.rand(16, 30)

fig, ax = plt.subplots()

m = ax.pcolor(xx)
m.set_zorder(-20)
w = ax.get_tightbbox(fig.canvas.get_renderer(),
                     call_axes_locator = True,
                     bbox_extra_artists = None)

ax.set_title("Value Return:\n"+str(w),
              fontsize = 10)

fig.suptitle('matplotlib.axes.Axes.get_tightbbox()\
 function Example', fontweight ="bold")

plt.show()
輸出:
相關用法
注:本文由純淨天空篩選整理自SHUBHAMSINGH10大神的英文原創作品 Matplotlib.axes.Axes.get_tightbbox() in Python。非經特殊聲明,原始代碼版權歸原作者所有,本譯文未經允許或授權,請勿轉載或複製。