Matplotlib是Python中的一個庫,它是數字的-NumPy庫的數學擴展。軸類包含大多數圖形元素:Axis,Tick,Line2D,Text,Polygon等,並設置坐標係。 Axes實例通過callbacks屬性支持回調。
matplotlib.axes.Axes.get_sketch_params()函數
matplotlib庫的axiss模塊中的Axes.get_sketch_params()函數用於獲取藝術家的草圖參數。
用法: Axes.get_sketch_params(self)
參數:此方法不接受任何參數。
返回:此方法返回藝術家的素描參數。
以下示例說明了matplotlib.axes中的matplotlib.axes.Axes.get_sketch_params()函數:
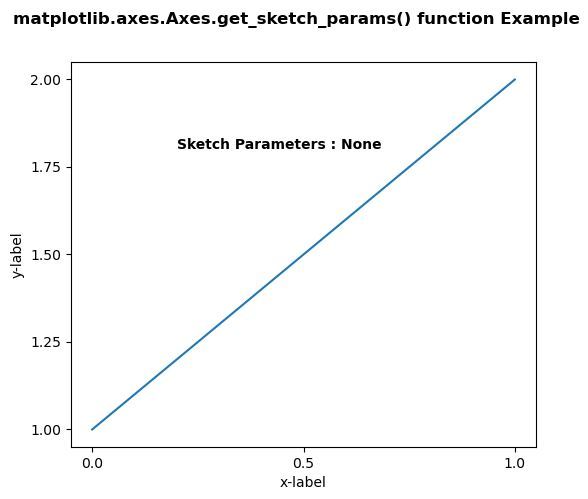
範例1:
# Implementation of matplotlib function
import matplotlib.pyplot as plt
import matplotlib.colors as mcolors
import matplotlib.gridspec as gridspec
import numpy as np


plt.rcParams['savefig.facecolor'] = "0.8"
plt.rcParams['figure.figsize'] = 6, 5

fig, ax = plt.subplots()

ax.plot([1, 2])

ax.locator_params("x", nbins = 3)
ax.locator_params("y", nbins = 5)

ax.set_xlabel('x-label')
ax.set_ylabel('y-label')

ax.text(0.2, 1.8, "Sketch Parameters:"
        +str(ax.get_sketch_params()),
        fontweight ="bold")

fig.suptitle('matplotlib.axes.Axes.get_sketch_params() \
function Example\n\n', fontweight ="bold")

plt.show()
輸出:
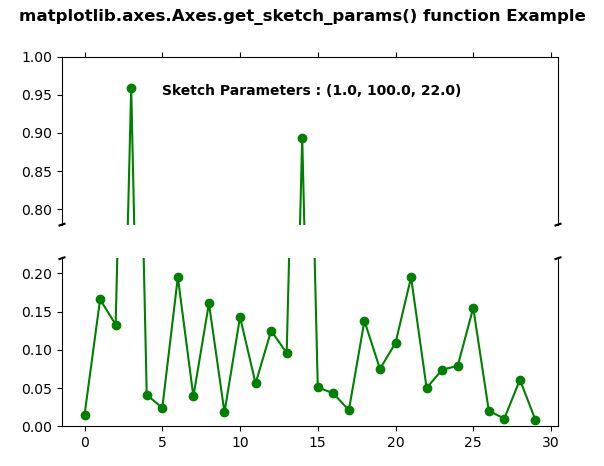
範例2:
# Implementation of matplotlib function
import matplotlib.pyplot as plt
import numpy as np

values = np.array([
    0.015, 0.166, 0.133,
    0.159, 0.041, 0.024,
    0.195, 0.039, 0.161,
    0.018, 0.143, 0.056,
    0.125, 0.096, 0.094,
    0.051, 0.043, 0.021,
    0.138, 0.075, 0.109,
    0.195, 0.050, 0.074,
    0.079, 0.155, 0.020,
    0.010, 0.061, 0.008])

values[[3, 14]] += .8

fig, (ax, ax2) = plt.subplots(2, 1,
                              sharex = True)

ax.plot(values, "o-", color ="green")
ax2.plot(values, "o-", color ="green")

ax.set_ylim(.78, 1.)
ax2.set_ylim(0, .22)

ax.spines['bottom'].set_visible(False)
ax2.spines['top'].set_visible(False)

ax.xaxis.tick_top()
ax.tick_params(labeltop = False)
ax2.xaxis.tick_bottom()

d = .005
kwargs = dict(transform = ax.transAxes,
              color ='k',
              clip_on = False)

ax.plot((-d, +d), (-d, +d), **kwargs)
ax.plot((1 - d, 1 + d), (-d, +d), **kwargs)

kwargs.update(transform = ax2.transAxes)
ax2.plot((-d, +d), (1 - d, 1 + d), **kwargs)
ax2.plot((1 - d, 1 + d), (1 - d, 1 + d), **kwargs)

ax.set_sketch_params(1.0, 100.0, 22.0)
ax2.set_sketch_params(1.0, 100.0, 22.0)

ax.text(5, .95, "Sketch Parameters:"
        +str(ax.get_sketch_params()),
        fontweight ="bold")

fig.suptitle('matplotlib.axes.Axes.get_sketch_params() \
function Example\n\n', fontweight ="bold")

plt.show()
輸出:
相關用法
注:本文由純淨天空篩選整理自SHUBHAMSINGH10大神的英文原創作品 Matplotlib.axes.Axes.get_sketch_params() in Python。非經特殊聲明,原始代碼版權歸原作者所有,本譯文未經允許或授權,請勿轉載或複製。