Matplotlib是Python中的一個庫,它是數字的-NumPy庫的數學擴展。軸類包含大多數圖形元素:Axis,Tick,Line2D,Text,Polygon等,並設置坐標係。 Axes實例通過callbacks屬性支持回調。
matplotlib.axes.Axes.get_shared_y_axes()函數
matplotlib庫的axiss模塊中的Axes.get_shared_y_axes()函數用於返回對y軸的共享軸Grouper對象的引用。
用法:
Axes.get_shared_y_axes(self)
以下示例說明了matplotlib.axes中的matplotlib.axes.Axes.get_shared_y_axes()函數:
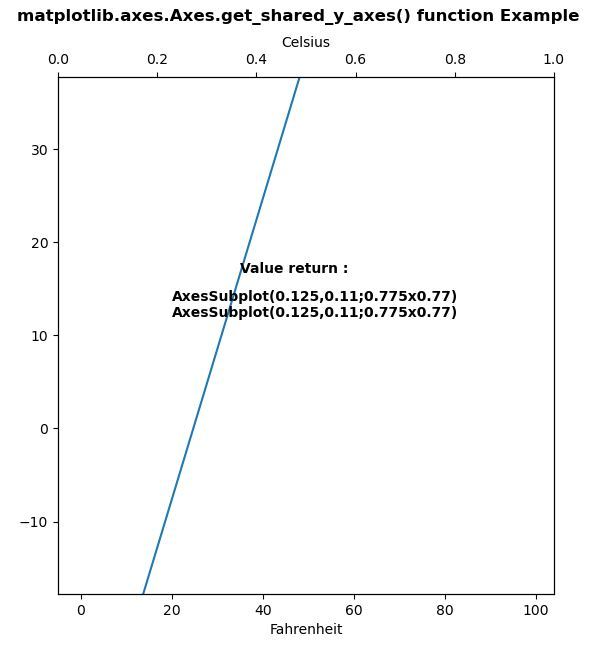
範例1:
# Implementation of matplotlib function
import matplotlib.pyplot as plt
import numpy as np


def GFG1(temp):
    return (5. / 9.) * (temp - 32)

def GFG2(ax1):
    y1, y2 = ax1.get_ylim()
    ax_twin .set_ylim(GFG1(y1), GFG1(y2))
    ax_twin .figure.canvas.draw()

fig, ax1 = plt.subplots()
ax_twin = ax1.twiny()

ax1.callbacks.connect("ylim_changed", GFG2)
ax1.plot(np.linspace(-40, 120, 100))
ax1.set_ylim(0, 100)

ax1.set_xlabel('Fahrenheit')
ax_twin .set_xlabel('Celsius')

w = ax1.get_shared_y_axes()
w1 = ax_twin.get_shared_y_axes()
for i in w:
    x, y = list(i)
    ax1.text(35, 15, "Value return:\n",
             fontweight ="bold")
    ax1.text(20, 12, str(x)+"\n"+str(y),
             fontweight ="bold")

fig.suptitle('matplotlib.axes.Axes.get_shared_y_axes() \
function Example\n\n', fontweight ="bold")
plt.show()
輸出:
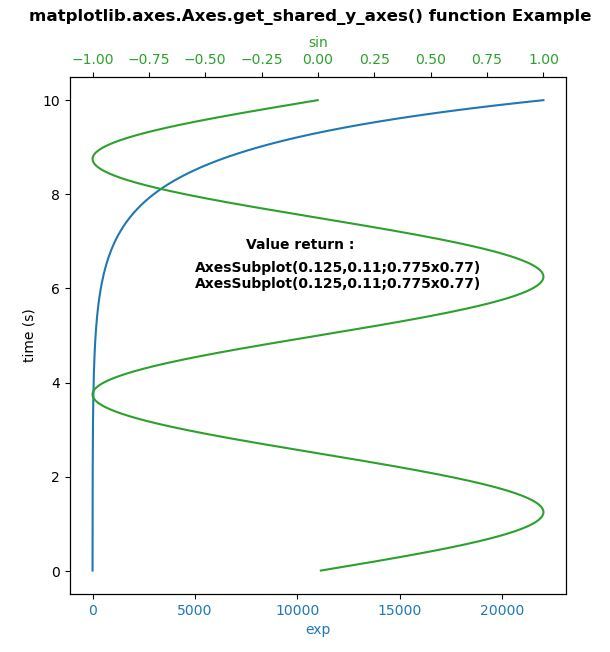
範例2:
# Implementation of matplotlib function
import numpy as np
import matplotlib.pyplot as plt

# Create some mock data
t = np.arange(0.01, 10.0, 0.001)
data1 = np.exp(t)
data2 = np.sin(0.4 * np.pi * t)

fig, ax1 = plt.subplots()

color = 'tab:blue'
ax1.set_ylabel('time (s)')
ax1.set_xlabel('exp', color = color)
ax1.plot(data1, t, color = color)
ax1.tick_params(axis ='x', labelcolor = color)

ax2 = ax1.twiny()

color = 'tab:green'
ax2.set_xlabel('sin', color = color)
ax2.plot(data2, t, color = color)
ax2.tick_params(axis ='x', labelcolor = color)

w = ax1.get_shared_y_axes()
w1 = ax2.get_shared_y_axes()
for i in w:
    x, y = list(i)
    ax1.text(7500, 6.5, "Value return:\n",
             fontweight ="bold")

    ax1.text(5000, 6, str(x)+"\n"+str(y),
             fontweight ="bold")

fig.suptitle('matplotlib.axes.Axes.get_shared_y_axes() \
function Example\n\n', fontweight ="bold")
plt.show()
輸出:
相關用法
注:本文由純淨天空篩選整理自SHUBHAMSINGH10大神的英文原創作品 Matplotlib.axes.Axes.get_shared_y_axes() in Python。非經特殊聲明,原始代碼版權歸原作者所有,本譯文未經允許或授權,請勿轉載或複製。