Matplotlib是Python中的一個庫,它是數字的-NumPy庫的數學擴展。軸類包含大多數圖形元素:Axis,Tick,Line2D,Text,Polygon等,並設置坐標係。 Axes實例通過callbacks屬性支持回調。
matplotlib.axes.Axes.get_position()函數
matplotlib庫的axes模塊中的Axes.set_position()函數用於獲取作為Bbox的axis矩形的副本。
用法: Axes.get_position(self, original=False)
參數:
- original:如果為true,則此參數用於返回原始位置。否則返回活動位置。
返回值:此方法將軸矩形的副本作為Bbox返回。
以下示例說明了matplotlib.axes中的matplotlib.axes.Axes.get_position()函數:
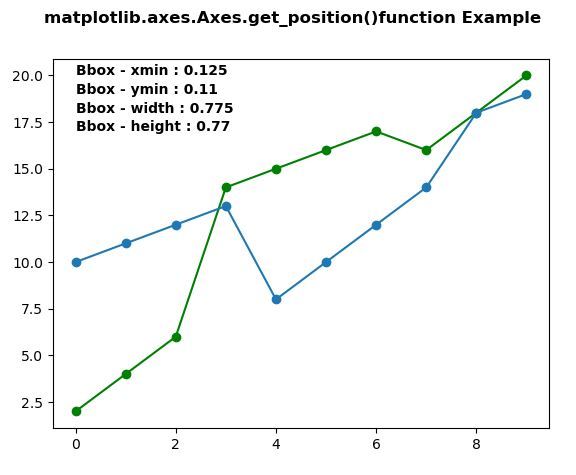
範例1:
# Implementation of matplotlib function
import matplotlib.pyplot as plt
import numpy as np

x = np.arange(10)
y = [2, 4, 6, 14, 15, 16, 17, 16, 18, 20]
y2 = [10, 11, 12, 13, 8, 10, 12, 14, 18, 19]

fig, ax1 = plt.subplots()

ax1.plot(x, y, "go-", label ='Line 1', )
ax1.plot(x, y2, "o-", label ='Line 2')

chartBox = ax1.get_position()
x, y, w, h = chartBox.x0, chartBox.y0, chartBox.width, chartBox.height

ax1.text(0, 20, "Bbox - xmin:"+str(x),
         fontweight ="bold")
ax1.text(0, 19, "Bbox - ymin:"+str(round(y, 2)),
         fontweight ="bold")
ax1.text(0, 18, "Bbox - width:"+str(w),
         fontweight ="bold")
ax1.text(0, 17, "Bbox - height:"+str(h),
         fontweight ="bold")
fig.suptitle('matplotlib.axes.Axes.get_position()\
function Example\n', fontweight ="bold")
plt.show()
輸出:
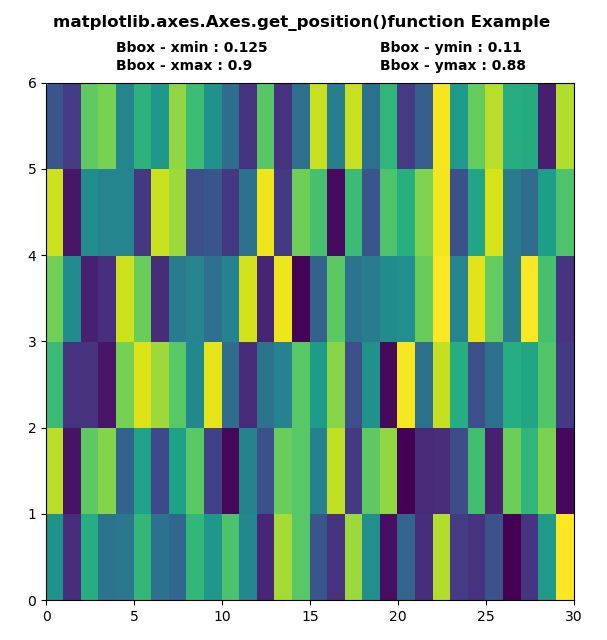
範例2:
# Implementation of matplotlib function
import matplotlib.pyplot as plt
import numpy as np
from matplotlib.colors import LogNorm

Z = np.random.rand(6, 30)

fig, ax1 = plt.subplots()

ax1.pcolor(Z)

chartBox = ax1.get_position()
x, y, x1, y1 = chartBox.x0, chartBox.y0, chartBox.x1, chartBox.y1

ax1.text(4, 6.35, "Bbox - xmin:"+str(x),
         fontweight ="bold")
ax1.text(19, 6.35, "Bbox - ymin:"+str(round(y, 2)),
         fontweight ="bold")
ax1.text(4, 6.15, "Bbox - xmax:"+str(x1),
         fontweight ="bold")
ax1.text(19, 6.15, "Bbox - ymax:"+str(y1),
         fontweight ="bold")
fig.suptitle('matplotlib.axes.Axes.get_position()\
function Example\n', fontweight ="bold")
plt.show()
輸出:
注:本文由純淨天空篩選整理自SHUBHAMSINGH10大神的英文原創作品 Matplotlib.axes.Axes.get_position() in Python。非經特殊聲明,原始代碼版權歸原作者所有,本譯文未經允許或授權,請勿轉載或複製。