Matplotlib是Python中的一個庫,它是數字的-NumPy庫的數學擴展。軸類包含大多數圖形元素:Axis,Tick,Line2D,Text,Polygon等,並設置坐標係。 Axes實例通過callbacks屬性支持回調。
matplotlib.axes.Axes.get_picker()函數
matplotlib庫的axiss模塊中的Axes.get_picker()函數用於返回藝術家的選擇行為。
用法: Axes.get_picker(self)
參數:此方法不接受任何參數。
返回:此方法是藝術家的挑選行為。
以下示例說明了matplotlib.axes中的matplotlib.axes.Axes.get_picker()函數:
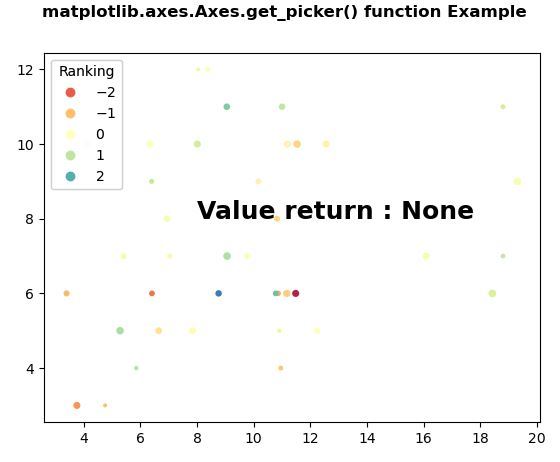
範例1:
#Implementation of matplotlib function
import numpy as np
np.random.seed(19680801)
import matplotlib.pyplot as plt


volume = np.random.rayleigh(7, size=40)
amount = np.random.poisson(7, size=40)
ranking = np.random.normal(size=40)
price = np.random.uniform(1, 7, size=40)

fig, ax = plt.subplots()

scatter = ax.scatter(volume,
                     amount,
                     c = ranking,
                     s = price*3,
                     vmin = -3,
                     vmax = 3,
                     cmap = "Spectral")

legend1 = ax.legend(*scatter.legend_elements(num=5),
                    loc = "upper left",
                    title = "Ranking")

ax.add_artist(legend1)

ax.text(8, 8,"Value return:" + str(ax.get_picker()),
        fontweight = "bold",
        fontsize=18)

fig.suptitle('matplotlib.axes.Axes.get_picker() function \
Example', fontweight="bold")

plt.show()
輸出:
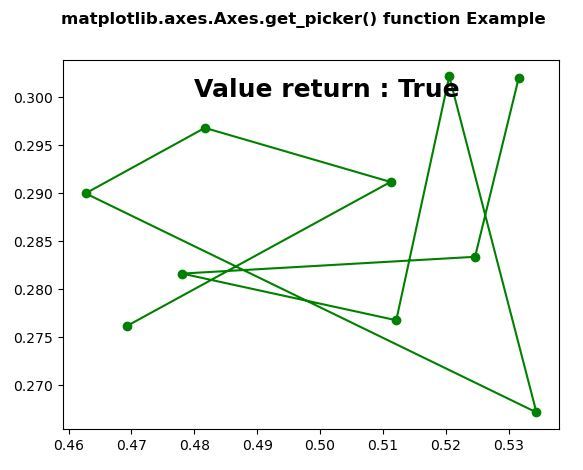
範例2:
# Implementation of matplotlib function
import numpy as np
import matplotlib.pyplot as plt


X = np.random.rand(10, 200)
xs = np.mean(X, axis = 1)
ys = np.std(X, axis = 1)

fig = plt.figure()
ax = fig.add_subplot(111)
line, = ax.plot(xs, ys, 'go-', picker = 5)

ax.set_picker(True)

ax.text(0.48, 0.3, "Value return:" + str(ax.get_picker()),
        fontweight = "bold",
        fontsize = 18)

fig.suptitle('matplotlib.axes.Axes.get_picker()\
function Example', fontweight ="bold")

plt.show()
輸出:
相關用法
注:本文由純淨天空篩選整理自SHUBHAMSINGH10大神的英文原創作品 Matplotlib.axes.Axes.get_picker() in Python。非經特殊聲明,原始代碼版權歸原作者所有,本譯文未經允許或授權,請勿轉載或複製。