Matplotlib是Python中的一個庫,它是數字的-NumPy庫的數學擴展。軸類包含大多數圖形元素:Axis,Tick,Line2D,Text,Polygon等,並設置坐標係。 Axes實例通過callbacks屬性支持回調。
matplotlib.axes.Axes.get_lines()函數
matplotlib庫的axiss模塊中的Axes.get_lines()函數用於返回Axes包含的線的列表
用法: Axes.get_lines(self)
參數:此方法不接受任何參數。
返回:此方法返回軸包含的行的列表。
以下示例說明了matplotlib.axes中的matplotlib.axes.Axes.get_lines()函數:
範例1:
# Implementation of matplotlib function
from matplotlib import colors
from matplotlib.ticker import PercentFormatter
import numpy as np
import matplotlib.pyplot as plt


N_points = 100000
x = np.random.randn(N_points)
y = .4 * x + np.random.randn(100000) + 5

fig, ax = plt.subplots()
ax.hist2d(x, y, bins = 100,
          norm = colors.LogNorm(),
          cmap ="Greens")

w = list(ax.get_lines())
if len(w)== 0:
    ax.text(-2, 8.5,
            "No line contained by the Axes \n")
else:
    ax.text(-3, 8.5,
            "List of the lines contained by the Axes \n")
    x = 8.5
    for i in w:

        ax.text(-3, x-0.5, str(i))
        x-= 0.5

fig.suptitle('matplotlib.axes.Axes.get_lines() \
function Example', fontweight ="bold")

plt.show()
輸出:

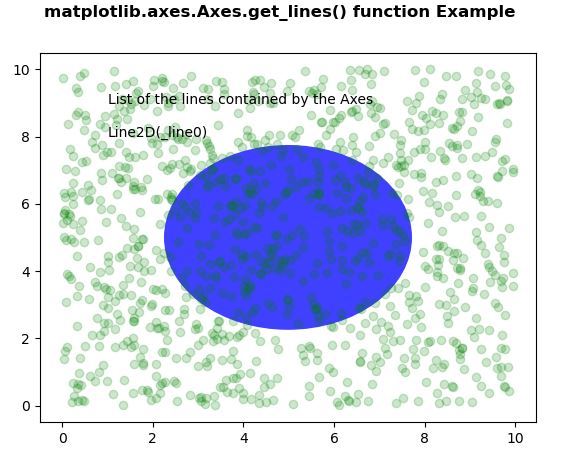
範例2:
# Implementation of matplotlib function
import numpy as np
import matplotlib.pyplot as plt
import matplotlib.patches as mpatches


fig, ax = plt.subplots()
x, y = 10 * np.random.rand(2, 1000)
ax.plot(x, y, 'go', alpha = 0.2)

circ = mpatches.Circle((0.5, 0.5),
                       0.25,
                       transform = ax.transAxes,
                       facecolor ='blue',
                       alpha = 0.75)

ax.add_patch(circ)

w = list(ax.get_lines())

if len(w)== 0:
    ax.text(1, 8.5,
            "No line contained by the Axes \n")

else:
    ax.text(1, 8.5,
            "List of the lines contained by the Axes \n")
    x = 8.5

    for i in w:
        ax.text(1, x-0.5, str(i))
        x-= 0.5

fig.suptitle('matplotlib.axes.Axes.get_lines() \
function Example', fontweight ="bold")

plt.show()
輸出:
相關用法
注:本文由純淨天空篩選整理自SHUBHAMSINGH10大神的英文原創作品 Matplotlib.axes.Axes.get_lines() in Python。非經特殊聲明,原始代碼版權歸原作者所有,本譯文未經允許或授權,請勿轉載或複製。