Matplotlib是Python中的一個庫,它是數字的-NumPy庫的數學擴展。軸類包含大多數圖形元素:Axis,Tick,Line2D,Text,Polygon等,並設置坐標係。 Axes實例通過callbacks屬性支持回調。
matplotlib.axes.Axes.get_legend_handles_labels()函數
matplotlib庫的axiss模塊中的Axes.get_legend_handles_labels()函數用於返回圖例的句柄和標簽。
用法: Axes.get_legend_handles_labels(self)
參數:此方法不接受任何參數。
返回:此函數返回圖例的句柄和標簽。
以下示例說明了matplotlib.axes中的matplotlib.axes.Axes.get_legend_handles_labels()函數:
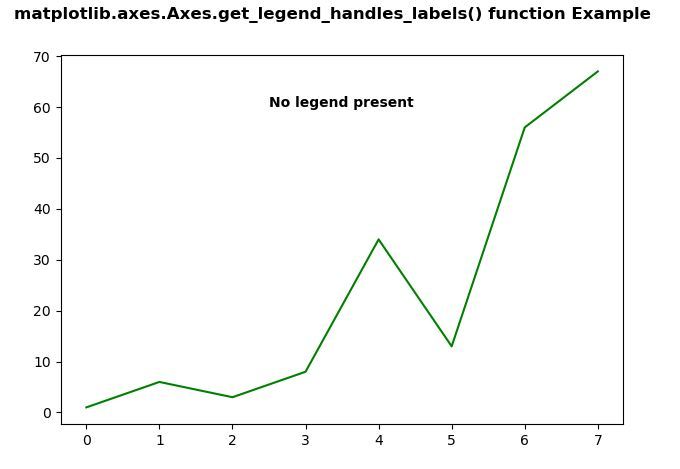
範例1:
# Implementation of matplotlib function
import matplotlib.pyplot as plt
import numpy as np

fig, ax = plt.subplots()
ax.plot([1, 6, 3, 8, 34, 13, 56, 67], color ="green")

h, l = ax.get_legend_handles_labels()
# print(h, l)
text ="Legend is present"
if h ==[]:
    text ="No legend present"
else:
    text+="and labels are:"+str(l)

ax.text(2.5, 60, text, fontweight ="bold")
fig.suptitle('matplotlib.axes.Axes.get_legend_handles_labels()\
 function Example\n', fontweight ="bold")
fig.canvas.draw()
plt.show()
輸出:
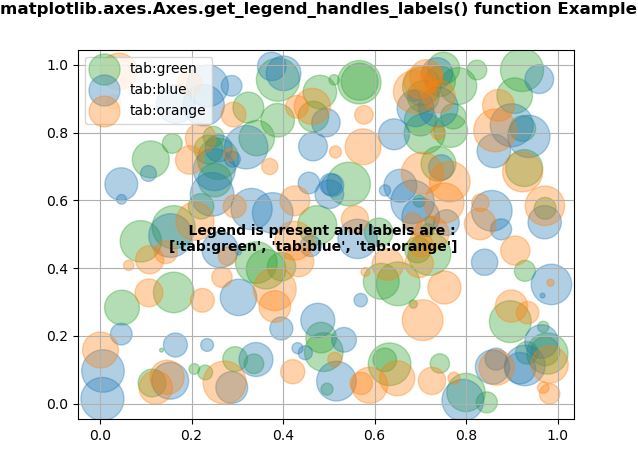
範例2:
# Implementation of matplotlib function
import numpy as np
np.random.seed(19680801)
import matplotlib.pyplot as plt


fig, ax = plt.subplots()
for color in [ 'tab:green', 'tab:blue', 'tab:orange']:
    n = 70
    x, y = np.random.rand(2, n)
    scale = 1000.0 * np.random.rand(n)
    ax.scatter(x, y, c = color, s = scale, label = color,
               alpha = 0.35)

ax.legend()
ax.grid(True)

h, l = ax.get_legend_handles_labels()
print(h, l)
text ="    Legend is present"
if h ==[]:
    text ="No legend present"
else:
    text+=" and labels are:\n"+str(l)

ax.text(0.15, 0.45, text, fontweight ="bold")
fig.suptitle('matplotlib.axes.Axes.get_legend_handles_labels()\
 function Example\n', fontweight ="bold")
fig.canvas.draw()
plt.show()
輸出:
相關用法
注:本文由純淨天空篩選整理自SHUBHAMSINGH10大神的英文原創作品 Matplotlib.axes.Axes.get_legend_handles_labels() in Python。非經特殊聲明,原始代碼版權歸原作者所有,本譯文未經允許或授權,請勿轉載或複製。