Matplotlib是Python中的一個庫,它是數字的-NumPy庫的數學擴展。軸類包含大多數圖形元素:Axis,Tick,Line2D,Text,Polygon等,並設置坐標係。 Axes實例通過callbacks屬性支持回調。
matplotlib.axes.Axes.get_label()函數
matplotlib庫的axes模塊中的Axes.get_label()函數用於獲取圖例中用於該藝術家的標簽。
用法: Axes.get_label(self)
參數:此方法不接受任何參數。
返回:此方法返回圖例中用於該藝術家的標簽。
以下示例說明了matplotlib.axes中的matplotlib.axes.Axes.get_label()函數:
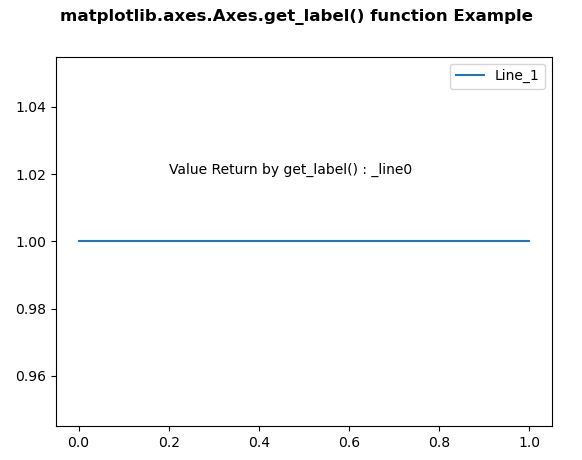
範例1:
# Implementation of matplotlib function
import matplotlib.pyplot as plt

fig, ax = plt.subplots()

x = [0, 1]
y = [1, 1]
line, = ax.plot(x, y)
ax.legend(("Line_1", ))

ax.text(0.2, 1.02, "Value Return by get_label()\
:" + str(line.get_label()))


fig.suptitle('matplotlib.axes.Axes.get_label() function\
Example\n\n', fontweight ="bold")

plt.show()
輸出:
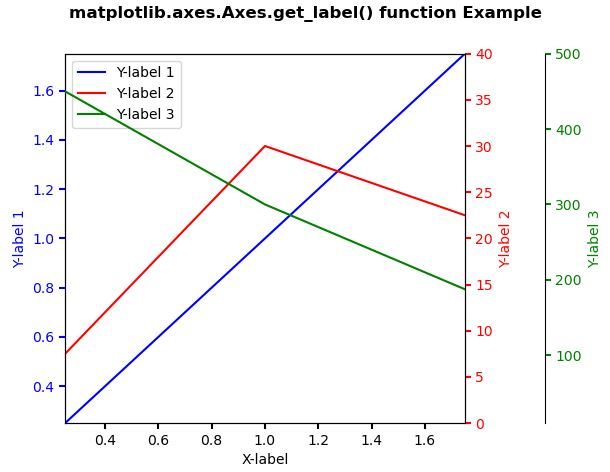
範例2:
# Implementation of matplotlib function
import matplotlib.pyplot as plt


def make_patch_spines_invisible(ax):
    ax.set_frame_on(True)
    ax.patch.set_visible(False)
    for sp in ax.spines.values():
        sp.set_visible(False)


fig, host = plt.subplots()
fig.subplots_adjust(right = 0.75)

par1 = host.twinx()
par2 = host.twinx()

# Offset the right spine of par2.
# The ticks and label have already been
# placed on the right by twinx above.
par2.spines["right"].set_position(("axes", 1.2))

# Having been created by twinx, par2 has
# its frame off, so the line of its
# detached spine is invisible.  First,
# activate the frame but make the patch
# and spines invisible.
make_patch_spines_invisible(par2)

# Second, show the right spine.
par2.spines["right"].set_visible(True)

p1, = host.plot([0, 1, 2], [0, 1, 2],
                "b-", label ="Y-label 1")
p2, = par1.plot([0, 1, 2], [0, 30, 20],
                "r-", label ="Y-label 2")
p3, = par2.plot([0, 1, 2], [500, 300, 150],
                "g-", label ="Y-label 3")

host.set_xlim(0.25, 1.75)
host.set_ylim(0.25, 1.75)
par1.set_ylim(0, 40)
par2.set_ylim(10, 500)

host.set_xlabel("X-label")
host.set_ylabel("Y-label 1")
par1.set_ylabel("Y-label 2")
par2.set_ylabel("Y-label 3")

host.yaxis.label.set_color(p1.get_color())
par1.yaxis.label.set_color(p2.get_color())
par2.yaxis.label.set_color(p3.get_color())

tkw = dict(size = 4, width = 1.5)
host.tick_params(axis ='y',
                 colors = p1.get_color(),
                 **tkw)
par1.tick_params(axis ='y',
                 colors = p2.get_color(),
                 **tkw)
par2.tick_params(axis ='y',
                 colors = p3.get_color(),
                 **tkw)
host.tick_params(axis ='x',
                 **tkw)

lines = [p1, p2, p3]

host.legend(lines, [l.get_label() for l in lines])

fig.suptitle('matplotlib.axes.Axes.get_label()\
function Example\n\n', fontweight ="bold")

plt.show()
輸出:
圖解:
相關用法
注:本文由純淨天空篩選整理自SHUBHAMSINGH10大神的英文原創作品 Matplotlib.axes.Axes.get_label() in Python。非經特殊聲明,原始代碼版權歸原作者所有,本譯文未經允許或授權,請勿轉載或複製。