Matplotlib是Python中的一個庫,它是數字的-NumPy庫的數學擴展。軸類包含大多數圖形元素:Axis,Tick,Line2D,Text,Polygon等,並設置坐標係。 Axes實例通過callbacks屬性支持回調。
matplotlib.axes.Axes.get_images()函數
matplotlib庫的axiss模塊中的Axes.get_images()函數用於返回由Axes包含的Axes圖像列表
用法: Axes.get_images(self)
參數:此方法不接受任何參數。
返回:此方法返回軸包含的軸圖像列表。
以下示例說明了matplotlib.axes中的matplotlib.axes.Axes.get_images()函數:
範例1:
# Implementation of matplotlib function
import matplotlib.pyplot as plt
import matplotlib.patches as patches
import matplotlib.cbook as cbook


# image used is
# https://media.geeksforgeeks.org/
# wp-content/uploads/20200402214740/geek.jpg
with cbook.get_sample_data('geek.jpg') as image_file:
    image = plt.imread(image_file)

fig, ax = plt.subplots()
im = ax.imshow(image)

patch = patches.Rectangle((0, 0), 260, 200,
                          transform = ax.transData)
im.set_clip_path(patch)

print("List of the child Artists of this Artist \n",
      *list(ax.get_images()), sep ="\n")

fig.suptitle('matplotlib.axes.Axes.get_images() \
function Example', fontweight ="bold")

plt.show()
輸出:

List of the Axes images contained by the Axes

AxesImage(80, 52.8;496x369.6)
範例2:
# Implementation of matplotlib function
import matplotlib.pyplot as plt
import numpy as np
from matplotlib.colors import LogNorm

dx, dy = 0.015, 0.05
x = np.arange(-4.0, 4.0, dx)
y = np.arange(-4.0, 4.0, dy)
X, Y = np.meshgrid(x, y)

extent = np.min(x), np.max(x), np.min(y), np.max(y)

fig, ax = plt.subplots()

Z1 = np.add.outer(range(8), range(8)) % 2
ax.imshow(Z1, cmap ="binary_r",
          interpolation ='nearest',
          extent = extent, alpha = 1)

def geeks(x, y):
    return (1 - x / 2 + x**5 + y**6) * np.exp(-(x**2 + y**2))

Z2 = geeks(X, Y)

ax.imshow(Z2, cmap ="Greens", alpha = 0.7,
          interpolation ='bilinear',
          extent = extent)

print("List of the Axes images contained by the Axes \n",
      *list(ax.get_images()), sep ="\n")

fig.suptitle('matplotlib.axes.Axes.get_images() function\
 Example', fontweight ="bold")
plt.show()
輸出:
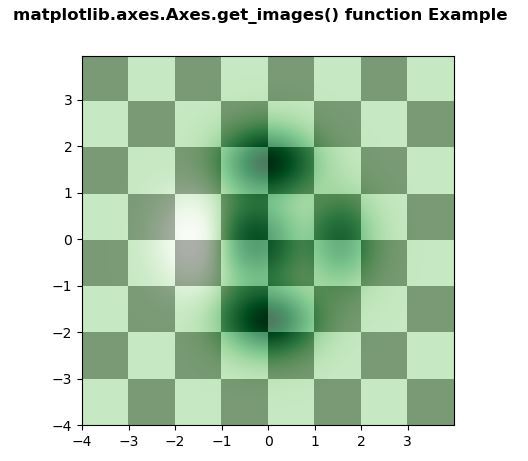
List of the Axes images contained by the Axes

AxesImage(80, 52.8;496x369.6)
AxesImage(80, 52.8;496x369.6)
相關用法
注:本文由純淨天空篩選整理自SHUBHAMSINGH10大神的英文原創作品 Matplotlib.axes.Axes.get_images() in Python。非經特殊聲明,原始代碼版權歸原作者所有,本譯文未經允許或授權,請勿轉載或複製。