Matplotlib是Python中的一個庫,它是數字的-NumPy庫的數學擴展。軸類包含大多數圖形元素:Axis,Tick,Line2D,Text,Polygon等,並設置坐標係。 Axes實例通過callbacks屬性支持回調。
matplotlib.axes.Axes.get_frame_on()函數
matplotlib庫的axiss模塊中的Axes.get_frame_on()函數用於獲取是否繪製了軸矩形麵片。
用法: Axes.get_frame_on(self)
參數:此方法不接受任何參數。
返回:此方法返回是否繪製軸矩形補丁。
以下示例說明了matplotlib.axes中的matplotlib.axes.Axes.get_frame_on()函數:
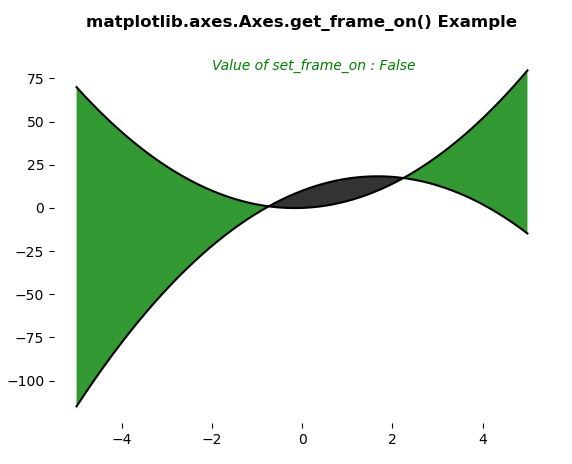
範例1:
# Implementation of matplotlib function
import numpy as np
import matplotlib.pyplot as plt

x = np.arange(-5, 5, 0.01)
y1 = -3 * x*x + 10 * x + 10
y2 = 3 * x*x + x

fig, ax = plt.subplots()
ax.plot(x, y1, x, y2, color ='black')
ax.fill_between(x, y1, y2, where = y2 >y1,
               facecolor ='green', alpha = 0.8)
ax.fill_between(x, y1, y2, where = y2 <= y1,
               facecolor ='black', alpha = 0.8)

ax.set_frame_on(False)
x = ax.get_frame_on()
ax.text(-2, 80, "Value of set_frame_on:" +str(x),
        style ='italic', fontsize = 10, color ="green")
ax.set_title('matplotlib.axes.Axes.get_frame_on()\
 Example\n', fontsize = 12, fontweight ='bold')
plt.show()
輸出:
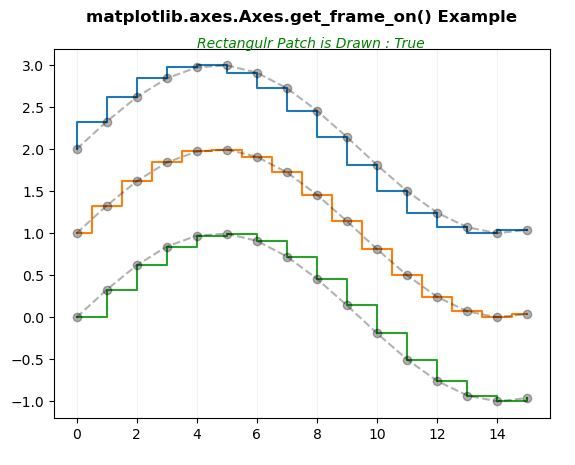
範例2:
# Implementation of matplotlib function
import numpy as np
import matplotlib.pyplot as plt

x = np.arange(16)
y = np.sin(x / 3)

fig, ax = plt.subplots()

ax.step(x, y + 2, label ='pre (default)')
ax.plot(x, y + 2, 'o--', color ='black', alpha = 0.3)

ax.step(x, y + 1, where ='mid', label ='mid')
ax.plot(x, y + 1, 'o--', color ='black', alpha = 0.3)

ax.step(x, y, where ='post', label ='post')
ax.plot(x, y, 'o--', color ='black', alpha = 0.3)

ax.grid(axis ='x', color ='0.95')

x = ax.get_frame_on()
ax.text(4, 3.2, "Rectangulr Patch is Drawn:" +str(x),
       style ='italic', fontsize = 10, color ="green")

ax.set_title('matplotlib.axes.Axes.get_frame_on()\
 Example\n', fontsize = 12, fontweight ='bold')
plt.show()
輸出:
注:本文由純淨天空篩選整理自SHUBHAMSINGH10大神的英文原創作品 Matplotlib.axes.Axes.get_frame_on() in Python。非經特殊聲明,原始代碼版權歸原作者所有,本譯文未經允許或授權,請勿轉載或複製。