Matplotlib是Python中的一個庫,它是數字的-NumPy庫的數學擴展。軸類包含大多數圖形元素:Axis,Tick,Line2D,Text,Polygon等,並設置坐標係。 Axes實例通過callbacks屬性支持回調。
matplotlib.axes.Axes.get_data_ratio()函數
matplotlib庫的axiss模塊中的Axes.get_data_ratio()函數用於獲取原始數據的長寬比。
用法: Axes.get_data_ratio(self)
參數:此方法不接受任何參數。
返回:此方法返回原始數據的縱橫比。
以下示例說明了matplotlib.axes中的matplotlib.axes.Axes.get_data_ratio()函數:
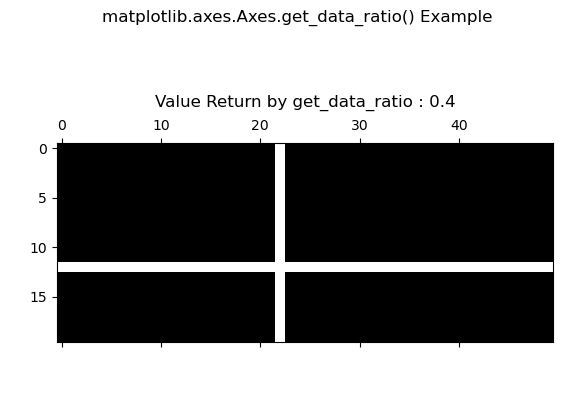
範例1:
# Implementation of matplotlib function
import matplotlib.pyplot as plt
import numpy as np

fig, ax1 = plt.subplots()

x = np.random.randn(20, 50)
x[12,:] = 0.
x[:, 22] = 0.

ax1.spy(x)
ax1.set_title("Value Return by get_data_ratio:"
              +str(ax1.get_data_ratio())+"\n")

fig.suptitle('matplotlib.axes.Axes.get_data_ratio() \
Example')

plt.show()
輸出:
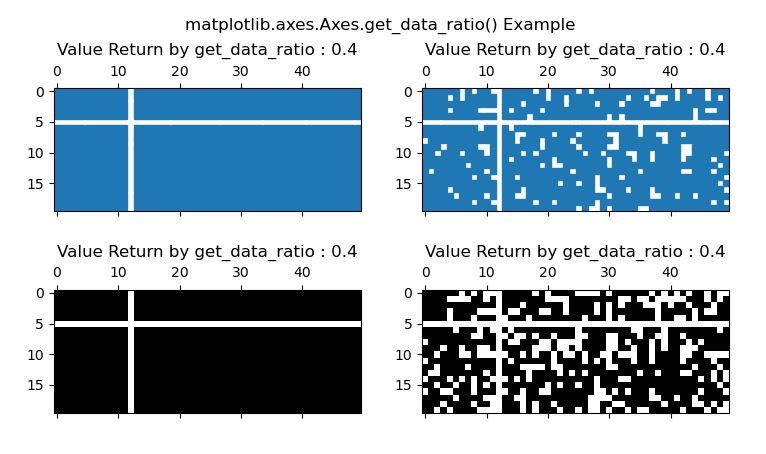
範例2:
# Implementation of matplotlib function
import matplotlib.pyplot as plt
import numpy as np

fig, [(ax1, ax2), (ax3, ax4)] = plt.subplots(2, 2)

x = np.random.randn(20, 50)
x[5,:] = 0.
x[:, 12] = 0.

ax1.spy(x, markersize = 4)
ax2.spy(x, precision = 0.2, markersize = 4)

ax3.spy(x)
ax4.spy(x, precision = 0.4)

ax1.set_title("Value Return by get_data_ratio:"
              +str(ax1.get_data_ratio())+"\n")


ax2.set_title("Value Return by get_data_ratio:"
              +str(ax2.get_data_ratio())+"\n")

ax3.set_title("Value Return by get_data_ratio:"
              +str(ax3.get_data_ratio())+"\n")

ax4.set_title("Value Return by get_data_ratio:"
              +str(ax4.get_data_ratio())+"\n")

fig.suptitle('matplotlib.axes.Axes.get_data_ratio\
 Example')

plt.show()
輸出:
相關用法
注:本文由純淨天空篩選整理自SHUBHAMSINGH10大神的英文原創作品 Matplotlib.axes.Axes.get_data_ratio() in Python。非經特殊聲明,原始代碼版權歸原作者所有,本譯文未經允許或授權,請勿轉載或複製。