Matplotlib是Python中的一個庫,它是數字的-NumPy庫的數學擴展。軸類包含大多數圖形元素:Axis,Tick,Line2D,Text,Polygon等,並設置坐標係。 Axes實例通過callbacks屬性支持回調。
matplotlib.axes.Axes.get_clip_path()函數
matplotlib庫的axiss模塊中的Axes.get_clip_path()函數用於獲取剪切路徑。
用法: Axes.get_clip_path(self)
參數:此方法不接受任何參數。
返回:此方法返回剪輯路徑。
以下示例說明了matplotlib.axes中的matplotlib.axes.Axes.get_clip_path()函數:
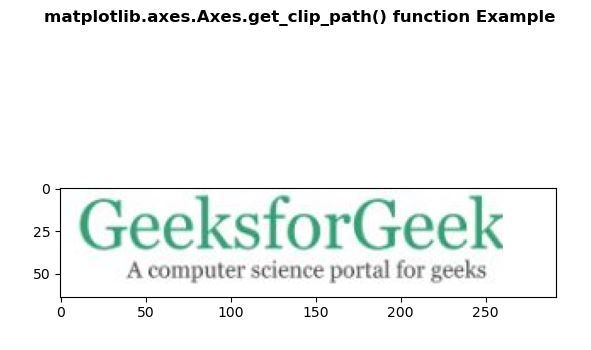
範例1:
輸入圖片:

# Implementation of matplotlib function
import matplotlib.pyplot as plt
import matplotlib.patches as patches
import matplotlib.cbook as cbook


with cbook.get_sample_data('geek.jpg') as image_file:
    image = plt.imread(image_file)

fig, ax = plt.subplots()
im = ax.imshow(image)

patch = patches.Rectangle((0, 0),
                          260,
                          200,
                          transform = ax.transData)

if im.get_clip_path() is None:
    im.set_clip_path(patch)

fig.suptitle('matplotlib.axes.Axes.get_clip_path() \
function Example\n\n', fontweight ="bold")

plt.show()
輸出:
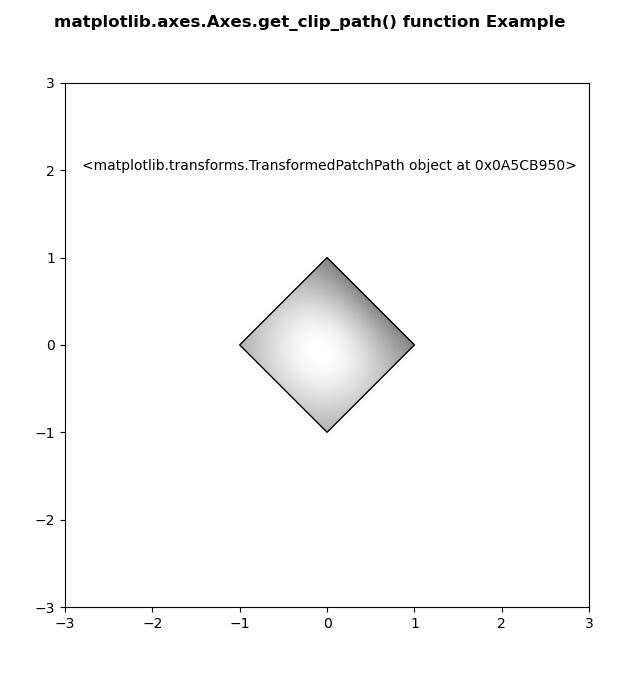
範例2:
# Implementation of matplotlib function
import numpy as np
import matplotlib.cm as cm
import matplotlib.pyplot as plt
from matplotlib.path import Path
from matplotlib.patches import PathPatch


delta = 0.025

x = y = np.arange(-3.0, 3.0, delta)
X, Y = np.meshgrid(x, y)

Z1 = np.exp(-X**2 - Y**2)
Z2 = np.exp(-(X - 1)**2 - (Y - 1)**2)
Z = (Z1 - Z2) * 2

path = Path([[0, 1], [1, 0], [0, -1],
             [-1, 0], [0, 1]])

patch = PathPatch(path, facecolor ='none')

fig, ax = plt.subplots()
ax.add_patch(patch)

im = ax.imshow(Z,
               interpolation ='bilinear',
               cmap = cm.gray,
               origin ='lower',
               extent =[-3, 3, -3, 3],
               clip_path = patch,
               clip_on = True)

ax.text(-2.8, 2, str(im.get_clip_path()))

fig.suptitle('matplotlib.axes.Axes.get_clip_path() \
function Example\n\n', fontweight ="bold")

plt.show()
輸出:
相關用法
注:本文由純淨天空篩選整理自SHUBHAMSINGH10大神的英文原創作品 Matplotlib.axes.Axes.get_clip_path() in Python。非經特殊聲明,原始代碼版權歸原作者所有,本譯文未經允許或授權,請勿轉載或複製。