Matplotlib是Python中的一個庫,它是數字的-NumPy庫的數學擴展。軸類包含大多數圖形元素:Axis,Tick,Line2D,Text,Polygon等,並設置坐標係。 Axes實例通過callbacks屬性支持回調。
matplotlib.axes.Axes.get_autoscale_on()函數
matplotlib庫的axiss模塊中的Axes.get_autoscale_on()函數用於獲取是否在繪圖命令上對兩個軸都應用了自動縮放。
用法: Axes.get_autoscale_on(self)
參數:此方法不接受任何參數。
返回值:此方法返回布爾值。
以下示例說明了matplotlib.axes中的matplotlib.axes.Axes.get_autoscale_on()函數:
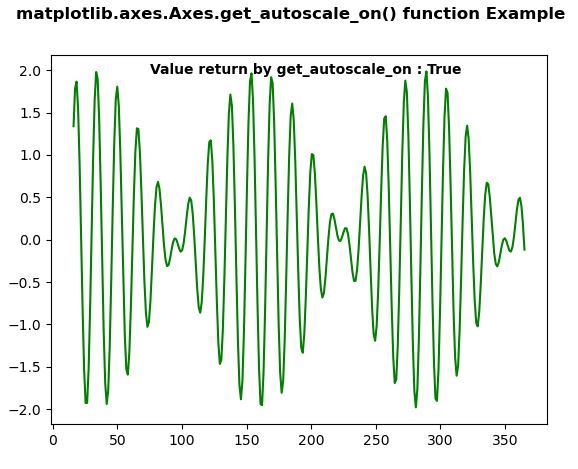
範例1:
# ImpleIn Reviewtation of matplotlib function
import numpy as np
import matplotlib.pyplot as plt

xdata = np.linspace(16, 365, 300)
ydata = np.sin(2 * np.pi * xdata / 15) + np.cos(2 * np.pi * xdata / 17)

fig, ax = plt.subplots()

ax.plot(xdata, ydata, 'g-')

w = ax.get_autoscale_on()
ax.text(75, 1.95, "Value return by get_autoscale_on:"
        + str(w), fontweight ="bold")

fig.suptitle('matplotlib.axes.Axes.get_autoscale_on() \
function Example\n', fontweight ="bold")
fig.canvas.draw()
plt.show()
輸出:
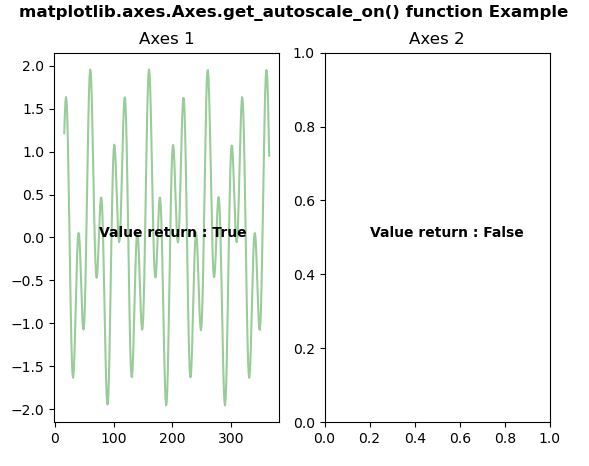
範例2:
# ImpleIn Reviewtation of matplotlib function
import numpy as np
import matplotlib.pyplot as plt

xdata = np.linspace(16, 365, (365-16))
ydata = np.sin(2 * np.pi * xdata / 50) + np.cos(2 * np.pi * xdata / 20)

fig, (ax, ax1) = plt.subplots(1, 2)

ax.plot(xdata, ydata, 'g-', alpha = 0.4)
ax.set_title("Axes 1")
ax1.plot(xdata, ydata, 'g-')
ax1.set_autoscale_on(False)
ax1.set_title("Axes 2")

w = ax.get_autoscale_on()
ax.text(75, 0, "Value return:" + str(w),
        fontweight ="bold")

w1 = ax1.get_autoscale_on()
ax1.text(0.2, 0.5, "Value return:" + str(w1),
         fontweight ="bold")

fig.suptitle('matplotlib.axes.Axes.get_autoscale_on()\
function Example\n', fontweight ="bold")
fig.canvas.draw()
plt.show()
輸出:
注:本文由純淨天空篩選整理自SHUBHAMSINGH10大神的英文原創作品 Matplotlib.axes.Axes.get_autoscale_on() in Python。非經特殊聲明,原始代碼版權歸原作者所有,本譯文未經允許或授權,請勿轉載或複製。