Matplotlib是Python中的一個庫,它是數字的-NumPy庫的數學擴展。軸類包含大多數圖形元素:Axis,Tick,Line2D,Text,Polygon等,並設置坐標係。 Axes實例通過callbacks屬性支持回調。
matplotlib.axes.Axes.format_xdata()函數
matplotlib庫的axiss模塊中的Axes.format_xdata()函數用於返回格式為x-value的x。
用法:
Axes.format_xdata(self, x)
以下示例說明了matplotlib.axes中的matplotlib.axes.Axes.format_xdata()函數:
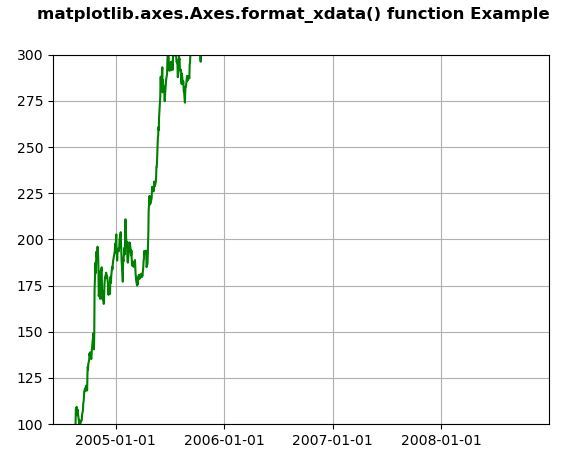
範例1:
# Implementation of matplotlib function
import numpy as np
import matplotlib.pyplot as plt
import matplotlib.dates as mdates
import matplotlib.cbook as cbook

years = mdates.YearLocator()
months = mdates.MonthLocator()
years_fmt = mdates.DateFormatter('% Y')

with cbook.get_sample_data('goog.npz') as datafile:
    data = np.load(datafile)['price_data'].view(np.recarray)

fig, ax = plt.subplots()
ax.plot('date', 'adj_close', data = data, color ="green")

ax.xaxis.set_major_locator(years)
ax.set_ylim((100, 300))

ax.format_xdata = mdates.DateFormatter('% m')
ax.grid(True)

fig.suptitle('matplotlib.axes.Axes.format_xdata() function\
 Example', fontweight ="bold")
plt.show()
輸出:
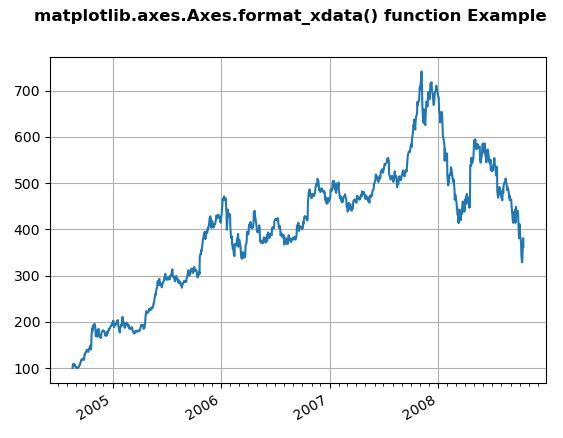
範例2:
# Implementation of matplotlib function
import numpy as np
import matplotlib.pyplot as plt
import matplotlib.dates as mdates
import matplotlib.cbook as cbook

years = mdates.YearLocator()
months = mdates.MonthLocator()
years_fmt = mdates.DateFormatter('% Y')

with cbook.get_sample_data('goog.npz') as datafile:
    data = np.load(datafile)['price_data']

fig, ax = plt.subplots()
ax.plot('date', 'adj_close', data = data)

ax.xaxis.set_major_locator(years)
ax.xaxis.set_major_formatter(years_fmt)
ax.xaxis.set_minor_locator(months)

ax.format_xdata = mdates.DateFormatter('% Y')
ax.grid(True)

fig.autofmt_xdate()

fig.suptitle('matplotlib.axes.Axes.format_xdata() function \
Example', fontweight ="bold")
plt.show()
輸出:
注:本文由純淨天空篩選整理自SHUBHAMSINGH10大神的英文原創作品 Matplotlib.axes.Axes.format_xdata() in Python。非經特殊聲明,原始代碼版權歸原作者所有,本譯文未經允許或授權,請勿轉載或複製。