Matplotlib是Python中的一個庫,它是數字的-NumPy庫的數學擴展。軸類包含大多數圖形元素:Axis,Tick,Line2D,Text,Polygon等,並設置坐標係。 Axes實例通過callbacks屬性支持回調。
Matplotlib.axes.Axes.format_coord()函數
matplotlib庫的axiss模塊中的Axes.format_coord()函數用於返回格式化x,y坐標的格式字符串。
用法: Axes.format_coord(self, x, y)
返回值:此方法返回格式化x,y坐標的格式字符串。
以下示例說明了matplotlib.axes.Axes.format_coord()matplotlib.axes中的函數:
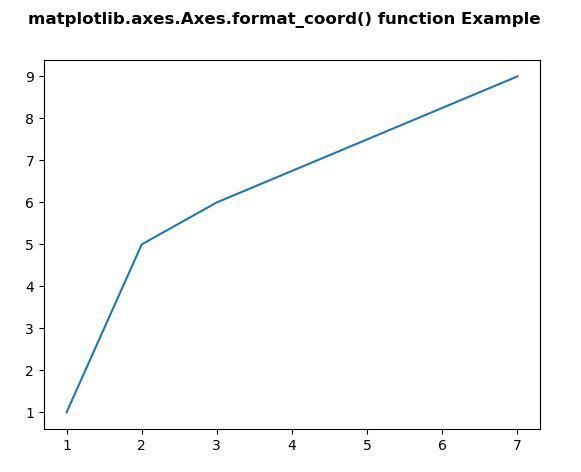
示例1:
# Implementation of matplotlib function
import numpy as np
import matplotlib.pyplot as plt
import matplotlib.pyplot as plt
import numpy as np

# make an agg figure
fig, ax = plt.subplots()
ax.plot([1, 2, 3, 7], [1, 5, 6, 9])

def format_coord(x = 7, y = 9):
    col = int(x + 0.5)
    row = int(y + 0.5)
    if col >= 0 and col < 5 and row >= 0 and row < 5:
        z = row + col
        return 'x =% 1.4f, y =% 1.4f, z =% 1.4f' % (x, y, z)
    else:
        return 'x =% 1.4f, y =% 1.4f' % (x, y)

ax.format_coord = format_coord

fig.suptitle('matplotlib.axes.Axes.format_coord()\
 function Example', fontweight ="bold")
plt.show()
輸出:
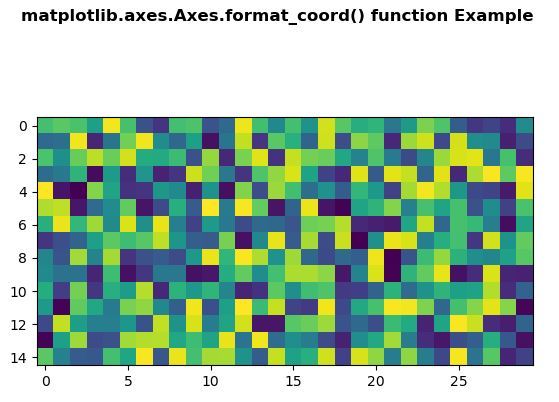
示例2:
# Implementation of matplotlib function
import numpy as np
import matplotlib.pyplot as plt

# Fixing random state for reproducibility
np.random.seed(19680801)


X = np.random.rand(15, 30)

fig, ax = plt.subplots()
ax.imshow(X)

val1, val2 = X.shape


def format_coord(x, y):
    col = int(x + 2)
    row = int(y - 2)
    if col >= 0 and col < val2 and row >= 0 and row < val1:
        z = X[row, col]
        return 'x =% 2.0f, y =% 2.0f, z =% 2.0f' % (x, y, z)
    else:
        return 'x =% 2.0f, y =% 2.0f' % (x, y)

ax.format_coord = format_coord

fig.suptitle('matplotlib.axes.Axes.format_coord() \
function Example', fontweight ="bold")
plt.show()
輸出:
相關用法
注:本文由純淨天空篩選整理自SHUBHAMSINGH10大神的英文原創作品 Matplotlib.axes.Axes.format_coord() in Python。非經特殊聲明,原始代碼版權歸原作者所有,本譯文未經允許或授權,請勿轉載或複製。