Matplotlib是Python中的一個庫,它是數字的-NumPy庫的數學擴展。軸類包含大多數圖形元素:Axis,Tick,Line2D,Text,Polygon等,並設置坐標係。 Axes實例通過callbacks屬性支持回調。
matplotlib.axes.Axes.findobj()函數
matplotlib庫的axes模塊中的Axes.findobj()函數用於查找藝術家對象。
用法: Axes.findobj(self, match=None, include_self=True)
參數:此方法接受以下參數。
- match:此參數是匹配的過濾條件。默認值為無。
- include_self:此參數將self包含在要檢查是否匹配的列表中。
返回值:此方法返回藝術家(藝術家列表)。
以下示例說明了matplotlib.axes中的matplotlib.axes.Axes.findobj()函數:
範例1:
# Implementation of matplotlib function
import matplotlib.pyplot as plt
from matplotlib.lines import Line2D
import numpy as np
from numpy.random import rand


fig, ax2 = plt.subplots()

ax2.bar(range(10), rand(10), picker = True)

for label in ax2.get_xticklabels():
    label.set_picker(True)

def onpick1(event):

    if isinstance(event.artist, Line2D):
        thisline = event.artist
        xdata = thisline.get_xdata()
        ydata = thisline.get_ydata()
        ind = event.ind
        print('onpick1 line:',
              np.column_stack([xdata[ind],
                               ydata[ind]]))

    elif isinstance(event.artist, Rectangle):
        patch = event.artist
        print('onpick1 patch:', patch.get_path())

    elif isinstance(event.artist, Text):
        text = event.artist
        print('onpick1 text:', text.get_text())

print("Value return:\n", *list(ax2.findobj()), sep ="\n")

fig.suptitle('matplotlib.axes.Axes.findobj() function Example',
             fontweight ="bold")

plt.show()
輸出:
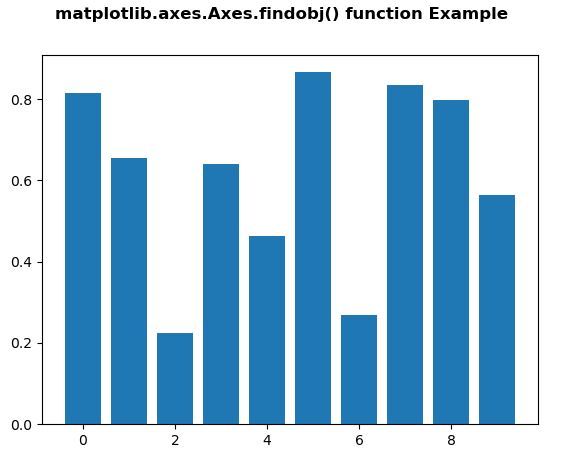
Value return:

Rectangle(xy=(-0.4, 0), width=0.8, height=0.815228, angle=0)
Rectangle(xy=(0.6, 0), width=0.8, height=0.655121, angle=0)
Rectangle(xy=(1.6, 0), width=0.8, height=0.225002, angle=0)
Rectangle(xy=(2.6, 0), width=0.8, height=0.639457, angle=0)
Rectangle(xy=(3.6, 0), width=0.8, height=0.463923, angle=0)
Rectangle(xy=(4.6, 0), width=0.8, height=0.865994, angle=0)
Rectangle(xy=(5.6, 0), width=0.8, height=0.269864, angle=0)
Rectangle(xy=(6.6, 0), width=0.8, height=0.834427, angle=0)
Rectangle(xy=(7.6, 0), width=0.8, height=0.79638, angle=0)
Rectangle(xy=(8.6, 0), width=0.8, height=0.564809, angle=0)
Spine
Spine
Spine
Spine
Text(0.5, 0, '')
Text(1, 0, '')
Line2D()
Line2D()
Line2D((0, 0), (0, 1))
Text(0, 0, '')
Text(0, 1, '')

Line2D()
Line2D()
Line2D((0, 0), (0, 1))
Text(0, 0, '')
Text(0, 1, '')

Line2D()
Line2D()
Line2D((0, 0), (0, 1))
Text(0, 0, '')
Text(0, 1, '')

Line2D()
Line2D()
Line2D((0, 0), (0, 1))
Text(0, 0, '')
Text(0, 1, '')

Line2D()
Line2D()
Line2D((0, 0), (0, 1))
Text(0, 0, '')
Text(0, 1, '')

Line2D()
Line2D()
Line2D((0, 0), (0, 1))
Text(0, 0, '')
Text(0, 1, '')

Line2D()
Line2D()
Line2D((0, 0), (0, 1))
Text(0, 0, '')
Text(0, 1, '')

XAxis(80.0, 52.8)
Text(0, 0.5, '')
Text(0, 0.5, '')
Line2D()
Line2D()
Line2D((0, 0), (1, 0))
Text(0, 0, '')
Text(1, 0, '')

Line2D()
Line2D()
Line2D((0, 0), (1, 0))
Text(0, 0, '')
Text(1, 0, '')

Line2D()
Line2D()
Line2D((0, 0), (1, 0))
Text(0, 0, '')
Text(1, 0, '')

Line2D()
Line2D()
Line2D((0, 0), (1, 0))
Text(0, 0, '')
Text(1, 0, '')

Line2D()
Line2D()
Line2D((0, 0), (1, 0))
Text(0, 0, '')
Text(1, 0, '')

Line2D()
Line2D()
Line2D((0, 0), (1, 0))
Text(0, 0, '')
Text(1, 0, '')

YAxis(80.0, 52.8)
Text(0.5, 1.0, '')
Text(0.0, 1.0, '')
Text(1.0, 1.0, '')
Rectangle(xy=(0, 0), width=1, height=1, angle=0)
AxesSubplot(0.125, 0.11;0.775x0.77)
範例2:
# Implementation of matplotlib function
import numpy as np
import matplotlib.pyplot as plt
import matplotlib.patches as mpatches


fig, ax = plt.subplots()
x, y = 10 * np.random.rand(2, 1000)
ax.plot(x, y, 'go', alpha = 0.2)

circ = mpatches.Circle((0.5, 0.5), 0.25,
                       transform = ax.transAxes,
                       facecolor ='blue',
                       alpha = 0.75)
ax.add_patch(circ)

print("Value return:\n", *list(ax.findobj()),
      sep ="\n")

fig.suptitle('matplotlib.axes.Axes.findobj()\
function Example', fontweight ="bold")

plt.show()
輸出:
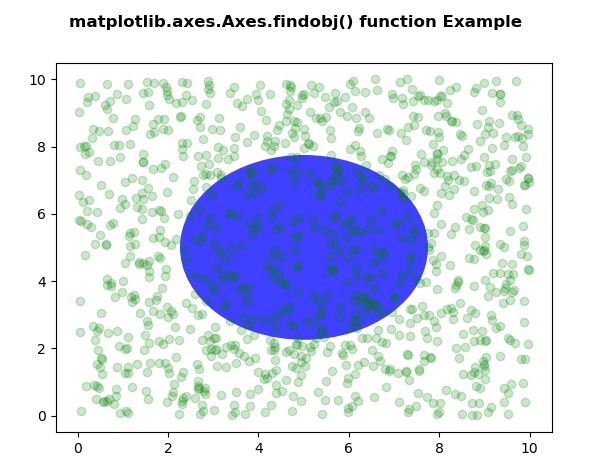
Value return:

Circle(xy=(0.5, 0.5), radius=0.25)
Line2D(_line0)
Spine
Spine
Spine
Spine
Text(0.5, 0, '')
Text(1, 0, '')
Line2D()
Line2D()
Line2D((0, 0), (0, 1))
Text(0, 0, '')
Text(0, 1, '')

Line2D()
Line2D()
Line2D((0, 0), (0, 1))
Text(0, 0, '')
Text(0, 1, '')

Line2D()
Line2D()
Line2D((0, 0), (0, 1))
Text(0, 0, '')
Text(0, 1, '')

Line2D()
Line2D()
Line2D((0, 0), (0, 1))
Text(0, 0, '')
Text(0, 1, '')

Line2D()
Line2D()
Line2D((0, 0), (0, 1))
Text(0, 0, '')
Text(0, 1, '')

Line2D()
Line2D()
Line2D((0, 0), (0, 1))
Text(0, 0, '')
Text(0, 1, '')

Line2D()
Line2D()
Line2D((0, 0), (0, 1))
Text(0, 0, '')
Text(0, 1, '')

Line2D()
Line2D()
Line2D((0, 0), (0, 1))
Text(0, 0, '')
Text(0, 1, '')

XAxis(80.0, 52.8)
Text(0, 0.5, '')
Text(0, 0.5, '')
Line2D()
Line2D()
Line2D((0, 0), (1, 0))
Text(0, 0, '')
Text(1, 0, '')

Line2D()
Line2D()
Line2D((0, 0), (1, 0))
Text(0, 0, '')
Text(1, 0, '')

Line2D()
Line2D()
Line2D((0, 0), (1, 0))
Text(0, 0, '')
Text(1, 0, '')

Line2D()
Line2D()
Line2D((0, 0), (1, 0))
Text(0, 0, '')
Text(1, 0, '')

Line2D()
Line2D()
Line2D((0, 0), (1, 0))
Text(0, 0, '')
Text(1, 0, '')

Line2D()
Line2D()
Line2D((0, 0), (1, 0))
Text(0, 0, '')
Text(1, 0, '')

Line2D()
Line2D()
Line2D((0, 0), (1, 0))
Text(0, 0, '')
Text(1, 0, '')

Line2D()
Line2D()
Line2D((0, 0), (1, 0))
Text(0, 0, '')
Text(1, 0, '')

YAxis(80.0, 52.8)
Text(0.5, 1.0, '')
Text(0.0, 1.0, '')
Text(1.0, 1.0, '')
Rectangle(xy=(0, 0), width=1, height=1, angle=0)
AxesSubplot(0.125, 0.11;0.775x0.77)
相關用法
注:本文由純淨天空篩選整理自SHUBHAMSINGH10大神的英文原創作品 Matplotlib.axes.Axes.findobj() in Python。非經特殊聲明,原始代碼版權歸原作者所有,本譯文未經允許或授權,請勿轉載或複製。