Matplotlib是Python中的一個庫,它是數字的-NumPy庫的數學擴展。軸類包含大多數圖形元素:Axis,Tick,Line2D,Text,Polygon等,並設置坐標係。 Axes實例通過callbacks屬性支持回調。
matplotlib.axes.Axes.fill_betweenx()函數
matplotlib庫的axiss模塊中的Axes.fill_betweenx()函數用於填充兩條垂直曲線之間的區域。
用法: Axes.fill_betweenx(self, y, x1, x2=0, where=None, step=None, interpolate=False, *, data=None, **kwargs)
參數:此方法接受以下描述的參數:
- y:該參數包含用於定義曲線的數據點的y坐標。
- x1:此參數包含用於定義第一條曲線的數據點的x坐標
- x2:該參數包含用於定義第二條曲線的數據點的x坐標。它是可選的,默認值為0。
- where:此參數是可選參數。它用於排除某些水平區域的填充。
- interpolate:此參數也是可選參數。它是錯誤欄行的線寬,默認值為NONE。
- step:此參數也是可選參數。它用於定義填充是否應為階躍函數。
返回值:這將返回包含繪製的多邊形的PolyCollection。
以下示例說明了matplotlib.axes中的matplotlib.axes.Axes.fill_betweenx()函數:
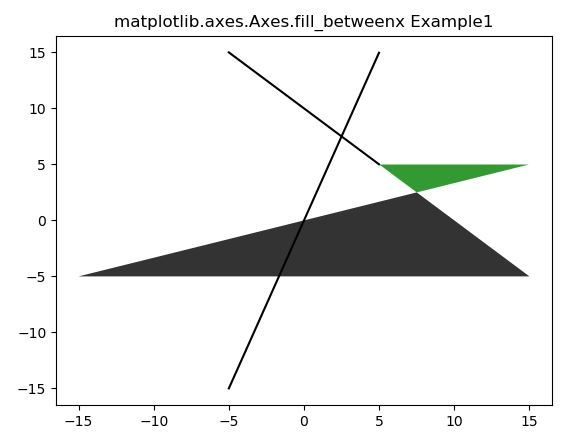
示例1:
# Implementation of matplotlib function

import numpy as np
import matplotlib.pyplot as plt

y = np.arange(-5, 5, 0.01)
x1 = -y * 2 + y + 10
x2 = 2 * y + y

fig, ax = plt.subplots()
ax.plot(y, x1, y, x2, color ='black')
ax.fill_betweenx(y, x1, x2, where = x2 >x1,
                 facecolor ='green', alpha = 0.8)

ax.fill_betweenx(y, x1, x2, where = x2 <= x1,
                 facecolor ='black', alpha = 0.8)

ax.set_title('matplotlib.axes.Axes.fill_betweenx Example1')
plt.show()
輸出:
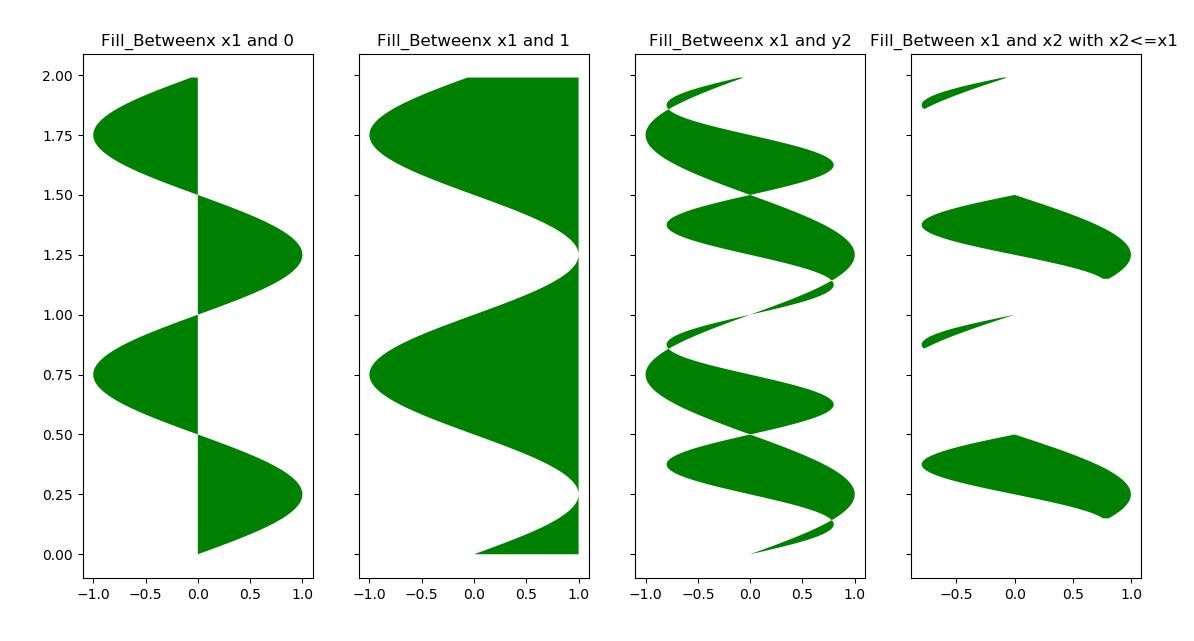
示例2:
# Implementation of matplotlib function

import numpy as np
import matplotlib.pyplot as plt

y = np.arange(0.0, 2, 0.01)
x1 = np.sin(2 * np.pi * y)
x2 = 0.8 * np.sin(4 * np.pi * y)

fig, [ax1, ax2, ax3, ax4] = plt.subplots(1, 4,
                                         sharey = True,
                                         figsize =(6, 6))

ax1.fill_betweenx(y, 0, x1, facecolor ='green')
ax1.set_title('Fill_Betweenx x1 and 0')

ax2.fill_betweenx(y, x1, 1, facecolor ='green')
ax2.set_title('Fill_Betweenx x1 and 1')

ax3.fill_betweenx(y, x1, x2, facecolor ='green')
ax3.set_title('Fill_Betweenx x1 and y2')

ax4.fill_betweenx(y, x1, x2, where = x2 <= x1,
                  facecolor ='green')

ax4.set_title('Fill_Between x1 and x2 with x2<= x1 ' )
plt.show()
輸出:
相關用法
注:本文由純淨天空篩選整理自SHUBHAMSINGH10大神的英文原創作品 matplotlib.axes.Axes.fill_betweenx() in Python。非經特殊聲明,原始代碼版權歸原作者所有,本譯文未經允許或授權,請勿轉載或複製。