Matplotlib是Python中的一個庫,它是數字的-NumPy庫的數學擴展。軸類包含大多數圖形元素:Axis,Tick,Line2D,Text,Polygon等,並設置坐標係。 Axes實例通過callbacks屬性支持回調。
matplotlib.axes.Axes.draw_artist()函數
matplotlib庫的axiss模塊中的Axes.draw_artist()函數用於有效地更新Axes數據。
用法: Axes.draw_artist(self, a)
參數:此方法接受以下參數。
- a:此參數是要繪製的藝術家。
返回值:此方法不返回任何值。
注意:僅在緩存渲染器的初始繪製之後才能使用此方法。
以下示例說明了matplotlib.axes中的matplotlib.axes.Axes.draw_artist()函數:
範例1:
# Implementation of matplotlib function
from random import randint, choice
import time
import matplotlib.pyplot as plt
import matplotlib.patches as mpatches


back_color = "black"
colors = ['red', 'green', 'blue', 'purple']
width, height = 4, 4

fig, ax = plt.subplots()
ax.set(xlim =[0, width], ylim =[0, height])

fig.canvas.draw()

def update():
    x = randint(0, width - 1)
    y = randint(0, height - 1)

    arti = mpatches.Rectangle(
        (x, y), 1, 1,
        facecolor = choice(colors),
        edgecolor = back_color
    )
    ax.add_artist(arti)

    start = time.time()
    ax.draw_artist(arti)
    fig.canvas.blit(ax.bbox)
    print("Draw at time:", time.time() - start)

timer = fig.canvas.new_timer(interval = 1)
timer.add_callback(update)
timer.start()

ax.set_title('matplotlib.axes.Axes.draw_artist()\
 function Example')

plt.show()
輸出:
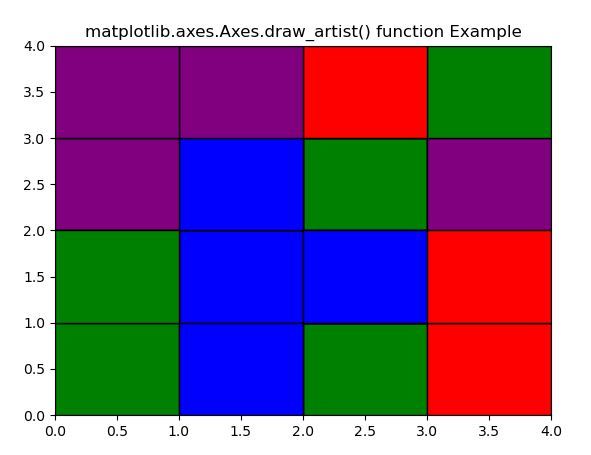
Draw at time:0.37501978874206543
Draw at time:0.015624046325683594
Draw at time:0.03127431869506836
Draw at time:0.015625953674316406
Draw at time:0.015601396560668945
Draw at time:0.015614986419677734
........
so on...
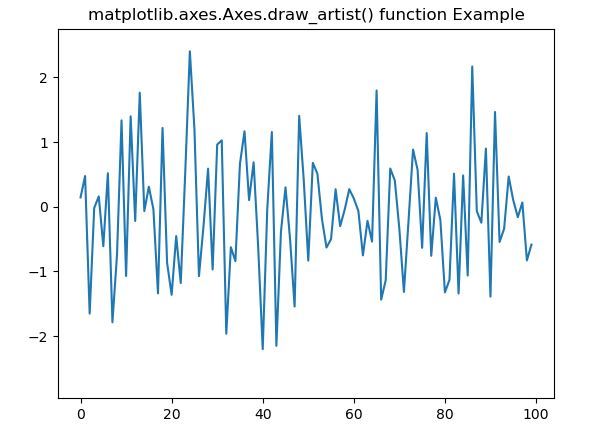
範例2:
# Implementation of matplotlib function
import matplotlib.pyplot as plt
import numpy as np
import time


fig, ax = plt.subplots()
line, = ax.plot(np.random.randn(100))

tstart = time.time()
num_plots = 0
fig.canvas.draw()

while time.time()-tstart < 5:
    line.set_ydata(np.random.randn(100))
    ax.draw_artist(ax.patch)
    ax.draw_artist(line)
    num_plots += 1

ax.set_title('matplotlib.axes.Axes.draw_artist() \
function Example')

plt.show()
輸出:
相關用法
注:本文由純淨天空篩選整理自SHUBHAMSINGH10大神的英文原創作品 Matplotlib.axes.Axes.draw_artist() in Python。非經特殊聲明,原始代碼版權歸原作者所有,本譯文未經允許或授權,請勿轉載或複製。