Matplotlib是Python中的一個庫,它是數字的-NumPy庫的數學擴展。軸類包含大多數圖形元素:Axis,Tick,Line2D,Text,Polygon等,並設置坐標係。 Axes實例通過callbacks屬性支持回調。
matplotlib.axes.Axes.drag_pan()函數
當在平移操作期間鼠標移動時,將調用matplotlib庫的axiss模塊中的Axes.drag_pan()函數。
用法: Axes.drag_pan(self, button, key, x, y)
參數:此方法接受以下描述的參數:
- x, y:這些參數是顯示坐標中的鼠標坐標。
- key:此參數是“shift”鍵。
- button:此參數是鼠標按鈕編號:
- 1:左
- 2:中
- 3:右
返回值:此方法不返回任何值。
以下示例說明了matplotlib.axes中的matplotlib.axes.Axes.drag_pan()函數:
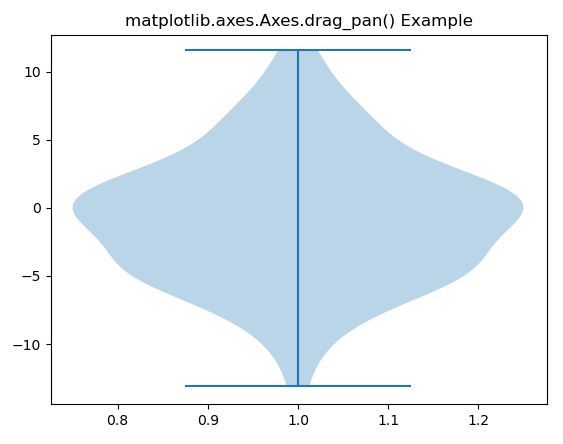
範例1:
# Implementation of matplotlib function
import matplotlib.pyplot as plt
import numpy as np

np.random.seed(10**7)
data = np.random.normal(0, 5, 100)

fig, ax1 = plt.subplots()
val = ax1.violinplot(data)

ax1.start_pan(1, 0, 3)
ax1.drag_pan(1, "shift", 0, 0.6)

ax1.set_title('matplotlib.axes.Axes.drag_pan() Example')
plt.show()
輸出:
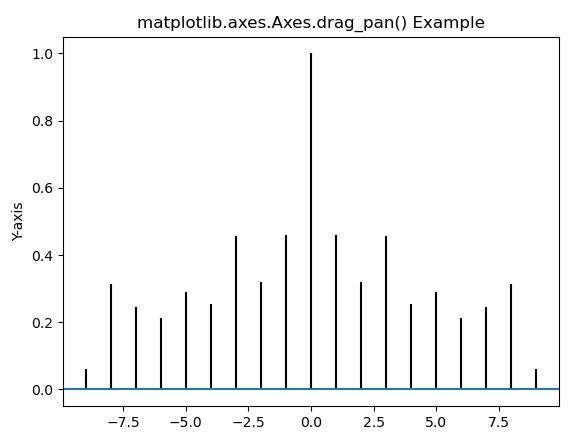
範例2:
# Implementation of matplotlib function
import matplotlib.pyplot as plt
import numpy as np

geeks = np.array([24.40, 110.25, 20.05,
                  22.00, 61.90, 7.80,
                  15.00, 22.80, 34.90,
                  57.30])

fig, ax = plt.subplots()
ax.acorr(geeks, maxlags = 9)

ax.set_ylabel('Y-axis')
ax.start_pan(0, 0.6, 1)
ax.drag_pan(1, "shift", 0, 0.6)

ax.set_title('matplotlib.axes.Axes.drag_pan() Example')
plt.show()
輸出:
注:本文由純淨天空篩選整理自SHUBHAMSINGH10大神的英文原創作品 Matplotlib.axes.Axes.drag_pan() in Python。非經特殊聲明,原始代碼版權歸原作者所有,本譯文未經允許或授權,請勿轉載或複製。