Matplotlib是Python中的一個庫,它是數字的-NumPy庫的數學擴展。軸類包含大多數圖形元素:Axis,Tick,Line2D,Text,Polygon等,並設置坐標係。 Axes實例通過callbacks屬性支持回調。
matplotlib.axes.Axes.can_pan()函數
matplotlib庫的axiss模塊中的Axes.can_pan()函數用於檢查軸是否支持任何平移/縮放按鈕函數。
用法: Axes.can_pan(self)
參數:此方法不接受任何參數。
返回值:如果支持任何平移/縮放按鈕函數,則此方法返回布爾值True。
以下示例說明了matplotlib.axes中的matplotlib.axes.Axes.can_pan()函數:
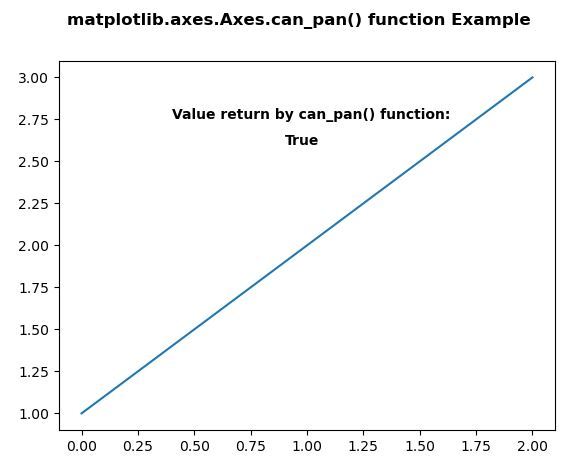
範例1:
# Implementation of matplotlib function
import matplotlib.pyplot as plt
import numpy as np


fig, ax = plt.subplots()
ax.plot([1, 2, 3])

w = ax.can_pan()
# print(w)

ax.text(0.4, 2.75, "Value return by can_pan() function:",
        fontweight ="bold")
ax.text(0.9, 2.6, w, fontweight ="bold")

fig.suptitle('matplotlib.axes.Axes.can_pan() function \
Example\n\n', fontweight ="bold")

plt.show()
輸出:
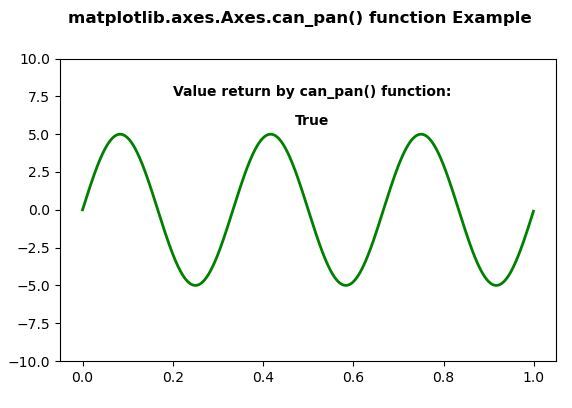
範例2:
# Implementation of matplotlib function
import numpy as np
import matplotlib.pyplot as plt
from matplotlib.widgets import Slider, Button, RadioButtons

fig, ax1 = plt.subplots()
plt.subplots_adjust(bottom = 0.25)
t = np.arange(0.0, 1.0, 0.001)
a0 = 5
f0 = 3
delta_f = 5.0
s = a0 * np.sin(2 * np.pi * f0 * t)

ax1.plot(t, s, lw = 2, color = 'green')
ax1.set_ymargin(0.5)

w = ax1.can_pan()

ax1.text(0.2, 7.5, "Value return by can_pan() function:",
         fontweight ="bold")
ax1.text(0.47, 5.6, w, fontweight ="bold")

fig.suptitle('matplotlib.axes.Axes.can_pan() function\
 Example\n\n', fontweight ="bold")

plt.show()
輸出:
注:本文由純淨天空篩選整理自SHUBHAMSINGH10大神的英文原創作品 matplotlib.axes.Axes.can_pan() in Python。非經特殊聲明,原始代碼版權歸原作者所有,本譯文未經允許或授權,請勿轉載或複製。