Matplotlib是Python中的一個庫,它是數字的-NumPy庫的數學擴展。軸類包含大多數圖形元素:Axis,Tick,Line2D,Text,Polygon等,並設置坐標係。 Axes實例通過callbacks屬性支持回調。
matplotlib.axes.Axes.broken_barh()函數
matplotlib庫的axiss模塊中的Axes.broken_barh()函數用於繪製矩形的水平序列。
用法:
Axes.broken_barh(self, xranges, yrange, *, data=None, **kwargs)
參數:此方法接受以下描述的參數:
- y:此參數是鋼筋的y坐標的序列。
- xranges:該參數是元組的序列(xmin,xwidth),它是x-positions,並且是矩形的延伸。
- yrange:該參數是元組的序列(ymin,yheight),它是y-positions,並擴展到所有矩形。
返回值:這將返回以下內容:
- BrokenBarHCollection:這將返回具有所有broken_barh的容器。
以下示例說明了matplotlib.axes中的matplotlib.axes.Axes.broken_barh()函數:
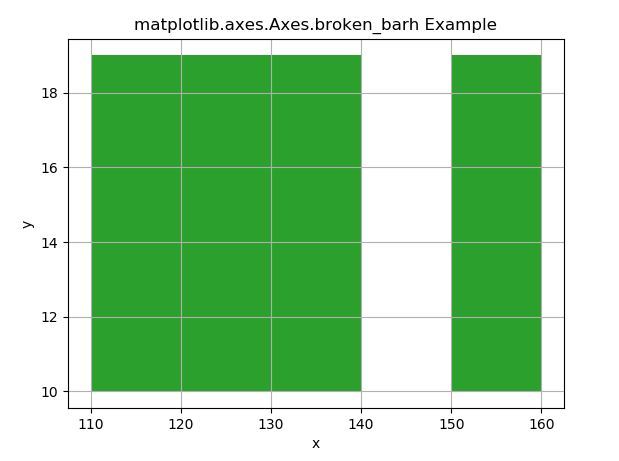
範例1:
# Implementation of matplotlib function
import matplotlib.pyplot as plt

fig, ax = plt.subplots()
ax.broken_barh([(110, 30), (150, 10)],
               (10, 9),
               facecolors ='tab:green')

ax.set_xlabel('x')
ax.set_ylabel('y')
ax.grid(True)

ax.set_title('matplotlib.axes.Axes.\
broken_barh Example')
plt.show()
輸出:
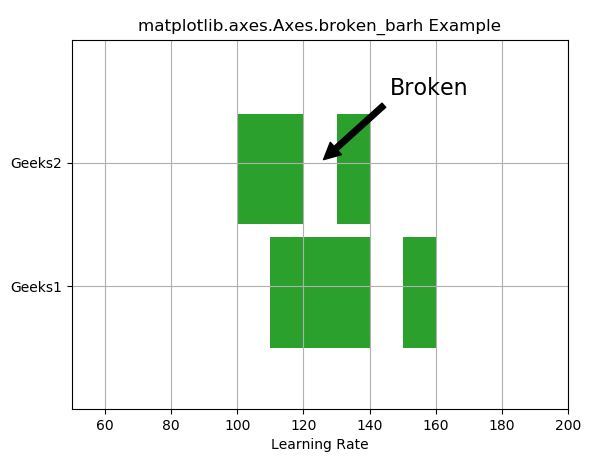
範例2:
# Implementation of matplotlib function
import matplotlib.pyplot as plt

fig, ax = plt.subplots()
ax.broken_barh([(110, 30), (150, 10)],
               (10, 9),
               facecolors ='tab:green')

ax.broken_barh([(100, 20),
                (130, 10)],
               (20, 9),
               facecolors =('tab:green'))

ax.set_ylim(5, 35)
ax.set_xlim(50, 200)
ax.set_xlabel('Learning Rate')
ax.set_yticks([15, 25])
ax.set_yticklabels(['Geeks1', 'Geeks2'])
ax.grid(True)

ax.annotate('Broken', (125, 25),
            xytext =(0.8, 0.9),
            textcoords ='axes fraction',
            arrowprops = dict(facecolor ='black',
                              shrink = 0.05),
            fontsize = 16,
            horizontalalignment ='right',
            verticalalignment ='top')

ax.set_title('matplotlib.axes.Axes.broken_barh Example')

plt.show()
輸出:
相關用法
注:本文由純淨天空篩選整理自SHUBHAMSINGH10大神的英文原創作品 Matplotlib.axes.Axes.broken_barh() in Python。非經特殊聲明,原始代碼版權歸原作者所有,本譯文未經允許或授權,請勿轉載或複製。