Matplotlib是Python中的一個庫,它是數字的-NumPy庫的數學擴展。軸類包含大多數圖形元素:Axis,Tick,Line2D,Text,Polygon等,並設置坐標係。 Axes實例通過callbacks屬性支持回調。
matplotlib.axes.Axes.barh()函數
matplotlib庫的axiss模塊中的Axes.barh()函數用於製作水平條形圖。
用法: Axes.barh(self, y, width, height=0.8, left=None, *, align=’center’, **kwargs)
參數:此方法接受以下描述的參數:
- y:此參數是鋼筋的y坐標的序列。
- height:此參數是鋼筋的高度。
- width:此參數是可選參數。它是條的寬度,默認值為0.8。
- left:此參數也是可選參數。它是條形圖左側的x坐標。
- align:此參數也是可選參數。它用於將條形圖與y坐標對齊。
返回值:這將返回以下內容:
- BarContainer:這將返回帶有所有條和可選的錯誤條的容器。
以下示例說明了matplotlib.axes中的matplotlib.axes.Axes.barh()函數:
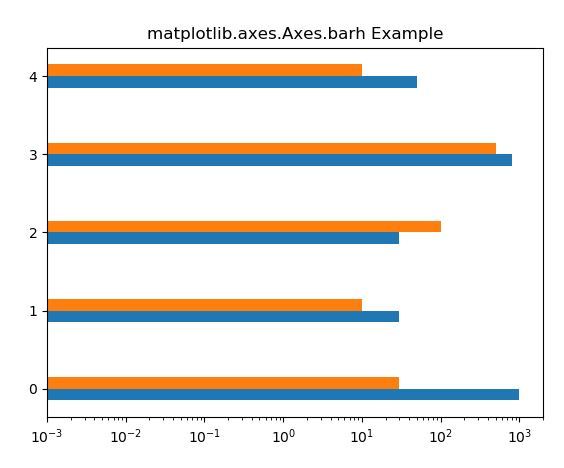
範例1:
# Implementation of matplotlib function
import matplotlib.pyplot as plt
import numpy as np

data = ((1000, 30), (30, 10),
        (30, 100), (800, 500),
        (50, 10))

dim = len(data[0])
w = 0.3
dimw = w / dim

fig, ax = plt.subplots()
x = np.arange(len(data))

for i in range(len(data[0])):
    y = [d[i] for d in data]
    b = ax.barh(x + i * dimw, y,
                dimw, left = 0.001)

ax.set_yticks(x + dimw / 2)
ax.set_yticklabels(map(str, x))
ax.set_xscale('log')

ax.set_title('matplotlib.axes.Axes.barh Example')

plt.show()
輸出:
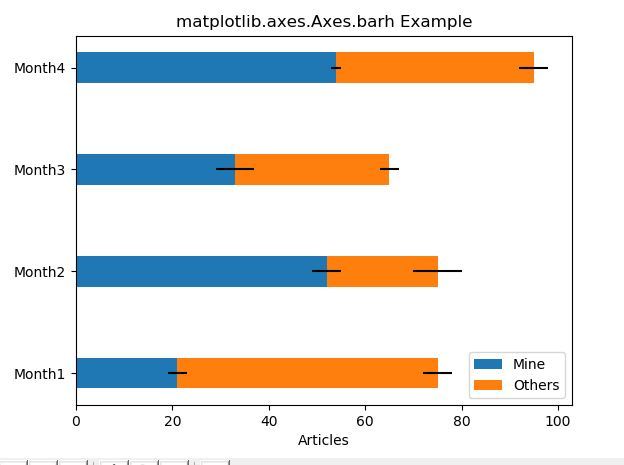
範例2:
# ImpleMinetation of matplotlib function
import numpy as np
import matplotlib.pyplot as plt

labels = ['Month1', 'Month2',
          'Month3', 'Month4']

mine = [21, 52, 33, 54]
others = [54, 23, 32, 41]
Mine_std = [2, 3, 4, 1]
Others_std = [3, 5, 2, 3]
width = 0.3

fig, ax = plt.subplots()

ax.barh(labels, mine, width,
        xerr = Mine_std,
        label ='Mine')

ax.barh(labels, others, width,
        xerr = Others_std,
        left = mine,
        label ='Others')

ax.set_xlabel('Articles')
ax.legend()

ax.set_title('matplotlib.axes.Axes.barh Example')

plt.show()
輸出:
相關用法
注:本文由純淨天空篩選整理自SHUBHAMSINGH10大神的英文原創作品 matplotlib.axes.Axes.barh() in Python。非經特殊聲明,原始代碼版權歸原作者所有,本譯文未經允許或授權,請勿轉載或複製。