Matplotlib是Python中的一個庫,它是數字的-NumPy庫的數學擴展。軸類包含大多數圖形元素:Axis,Tick,Line2D,Text,Polygon等,並設置坐標係。 Axes實例通過callbacks屬性支持回調。
matplotlib.axes.Axes.autoscale_view()函數
matplotlib庫的axiss模塊中的Axes.autoscale_view()函數用於使用數據限製自動縮放視圖限製。
用法: Axes.autoscale_view(self, tight=None, scalex=True, scaley=True)
參數:此方法接受以下參數。
- scalex:此參數用於確定是否自動縮放x軸。
- scaley:此參數用於確定是否自動縮放y軸。
- tight:此參數用於使用邊距擴展軸限製。
返回值:此方法不返回任何值。
以下示例說明了matplotlib.axes中的matplotlib.axes.Axes.autoscale()函數:
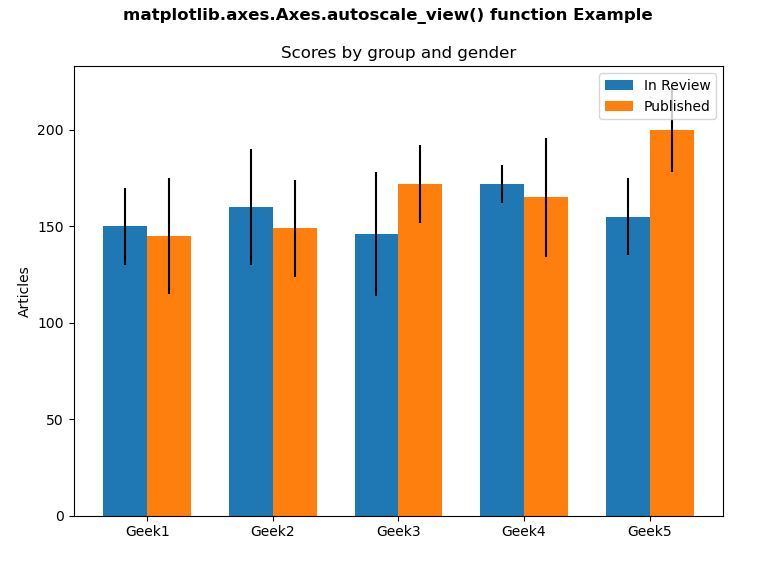
範例1:
# ImpleIn Reviewtation of matplotlib function
import numpy as np
from basic_units import cm, inch
import matplotlib.pyplot as plt


N = 5
val1 = [150 * cm, 160 * cm, 146 * cm,
        172 * cm, 155 * cm]

val2 = [20 * cm, 30 * cm, 32 * cm,
        10 * cm, 20 * cm]

fig, ax = plt.subplots()

ind = np.arange(N)
width = 0.35
ax.bar(ind, val1, width, bottom = 0 * cm,
       yerr = val2, label ='In Review')

woval1 = (145 * cm, 149 * cm, 172 * cm,
          165 * cm, 200 * cm)
woval2 = (30 * cm, 25 * cm, 20 * cm,
          31 * cm, 22 * cm)
ax.bar(ind + width, woval1, width,
       bottom = 0 * cm, yerr = woval2,
       label ='Published')

ax.set_title('Scores by group and gender')
ax.set_xticks(ind + width / 2)
ax.set_xticklabels(('Geek1', 'Geek2',
                    'Geek3', 'Geek4',
                    'Geek5'))

ax.legend()
ax.set_ylabel("Articles")
ax.autoscale_view()

fig.suptitle('matplotlib.axes.Axes.autoscale_view()\
function Example\n', fontweight ="bold")
fig.canvas.draw()
plt.show()
輸出:
範例2:
# Implementation of matplotlib function
import matplotlib.pyplot as plt
from matplotlib import collections, colors, transforms
import numpy as np

nverts = 50
npts = 100

r = np.arange(nverts)
theta = np.linspace(0, 2 * np.pi, nverts)
xx = r * np.sin(theta)
yy = r * np.cos(theta)
spiral = np.column_stack([xx, yy])

rs = np.random.RandomState(19680801)

xyo = rs.randn(npts, 2)

colors = [colors.to_rgba(c)
          for c in plt.rcParams['axes.prop_cycle'].by_key()['color']]

fig, [ax1, ax2] = plt.subplots(1, 2)

col = collections.RegularPolyCollection(
    7, sizes = np.abs(xx) * 10.0, offsets = xyo,
    transOffset = ax1.transData)
trans = transforms.Affine2D().scale(fig.dpi / 72.0)
col.set_transform(trans)
ax1.add_collection(col, autolim = True)
col.set_color(colors)
ax1.set_title("Without autoscale_view() function")

col = collections.RegularPolyCollection(
    7, sizes = np.abs(xx) * 10.0, offsets = xyo,
    transOffset = ax2.transData)

trans = transforms.Affine2D().scale(fig.dpi / 72.0)
col.set_transform(trans)
ax2.add_collection(col, autolim = True)
col.set_color(colors)
ax2.autoscale_view()
ax2.set_title("Using autoscale_view() function")

fig.suptitle('matplotlib.axes.Axes.autoscale_view()\
 function Example\n', fontweight ="bold")
fig.canvas.draw()
plt.show()
輸出:
相關用法
注:本文由純淨天空篩選整理自SHUBHAMSINGH10大神的英文原創作品 Matplotlib.axes.Axes.autoscale_view() in Python。非經特殊聲明,原始代碼版權歸原作者所有,本譯文未經允許或授權,請勿轉載或複製。