Matplotlib是Python中的一個庫,它是數字的-NumPy庫的數學擴展。軸類包含大多數圖形元素:Axis,Tick,Line2D,Text,Polygon等,並設置坐標係。 Axes實例通過callbacks屬性支持回調。
matplotlib.axes.Axes.autoscale()函數
matplotlib庫的axiss模塊中的Axes.autoscale()函數用於將軸視圖自動縮放為數據(切換)。
用法: Axes.autoscale(self, enable=True, axis=’both’, tight=None)
參數:此方法接受以下參數。
- enable:如果此參數為True(默認),則打開自動縮放函數;如果為False,則將其關閉。
- axis:該參數用於要在哪個軸上運行。 {“ both”,“ x”,“ y”}
- tight:此參數轉發到autoscale_view。
返回值:此方法不返回任何值。
以下示例說明了matplotlib.axes中的matplotlib.axes.Axes.autoscale()函數:
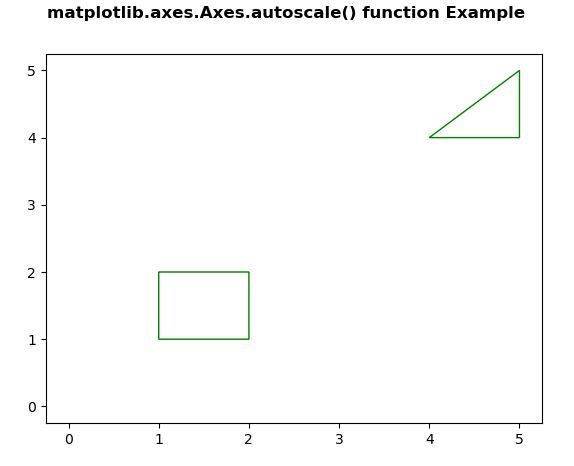
範例1:
# Implementation of matplotlib function
import numpy as np
from matplotlib.path import Path
from matplotlib.patches import PathPatch
import matplotlib.pyplot as plt


vertices = []
codes = []

codes = [Path.MOVETO] + [Path.LINETO]*3 + [Path.CLOSEPOLY]
vertices = [(1, 1), (1, 2), (2, 2),
            (2, 1), (0, 0)]

codes += [Path.MOVETO] + [Path.LINETO]*2 + [Path.CLOSEPOLY]
vertices += [(4, 4), (5, 5), (5, 4),
             (0, 0)]

vertices = np.array(vertices, float)
path = Path(vertices, codes)

pathpatch = PathPatch(path, facecolor ='None',
                      edgecolor ='green')

fig, ax = plt.subplots()
ax.add_patch(pathpatch)
ax.autoscale()

fig.suptitle('matplotlib.axes.Axes.autoscale() \
function Example\n', fontweight ="bold")
fig.canvas.draw()
plt.show()
輸出:
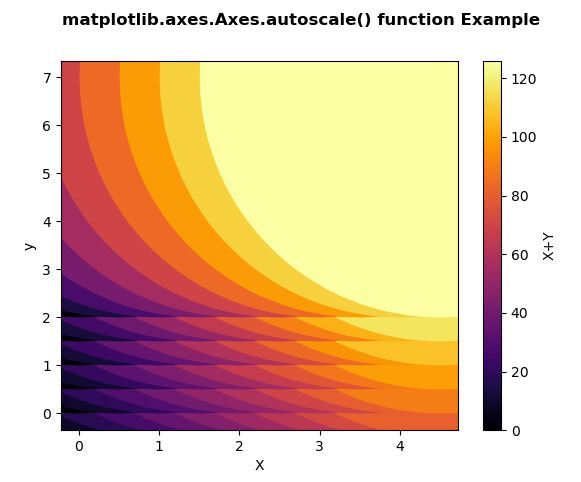
範例2:
# Implementation of matplotlib function
import matplotlib.pyplot as plt
import numpy as np
from matplotlib.collections import EllipseCollection

x = np.arange(10)
y = np.arange(15)
X, Y = np.meshgrid(x, y)

XY = np.column_stack((X.ravel(), Y.ravel()))

fig, ax = plt.subplots()

ec = EllipseCollection(10, 10, 5, units ='y',
                       offsets = XY * 0.5,
                       transOffset = ax.transData,
                       cmap ="inferno")

ec.set_array((X * Y).ravel())
ax.add_collection(ec)
ax.autoscale_view()
ax.set_xlabel('X')
ax.set_ylabel('y')
cbar = plt.colorbar(ec)
cbar.set_label('X + Y')

fig.suptitle('matplotlib.axes.Axes.autoscale() function \
Example\n', fontweight ="bold")
fig.canvas.draw()
plt.show()
輸出:
相關用法
注:本文由純淨天空篩選整理自SHUBHAMSINGH10大神的英文原創作品 Matplotlib.axes.Axes.autoscale() in Python。非經特殊聲明,原始代碼版權歸原作者所有,本譯文未經允許或授權,請勿轉載或複製。