Matplotlib是Python中的一個庫,它是數字的-NumPy庫的數學擴展。軸類包含大多數圖形元素:Axis,Tick,Line2D,Text,Polygon等,並設置坐標係。 Axes實例通過callbacks屬性支持回調。
matplotlib.axes.Axes.add_patch()函數
matplotlib庫的axiss模塊中的Axes.add_patch()函數用於將補丁添加到軸的補丁;返回補丁。
用法: Axes.add_patch(self, p)
參數:此方法接受以下參數。
- line:此參數是軸補丁的補丁。
返回值:此方法返回Patch。
以下示例說明了matplotlib.axes中的matplotlib.axes.Axes.add_patch()函數:
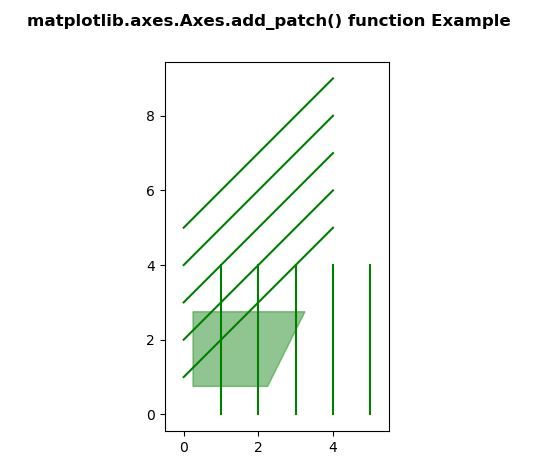
範例1:
# Implementation of matplotlib function
import numpy as np
import matplotlib.pyplot as plt

y, x = np.mgrid[:5, 1:6]
poly_coords = [
    (0.25, 2.75), (3.25, 2.75),
    (2.25, 0.75), (0.25, 0.75)
]
fig, ax = plt.subplots()

cells = ax.plot(x, y, x + y, color ='green')
ax.add_patch(
    plt.Polygon(poly_coords, color ='forestgreen',
                alpha = 0.5)
    )
ax.margins(x = 0.1, y = 0.05)
ax.set_aspect('equal')

fig.suptitle('matplotlib.axes.Axes.add_patch() \
function Example\n\n', fontweight ="bold")
plt.show()
輸出:
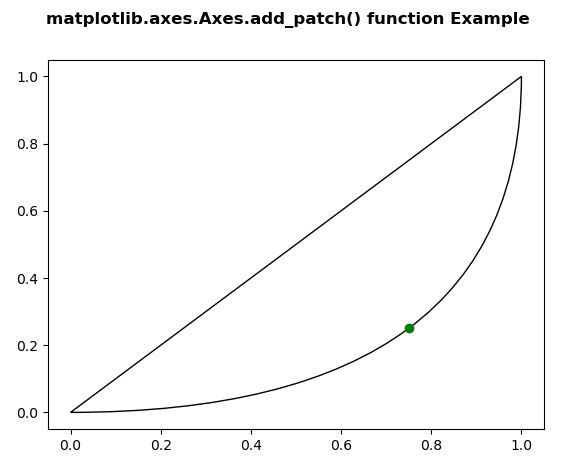
範例2:
# Implementation of matplotlib function
import matplotlib.path as mpath
import matplotlib.patches as mpatches
import matplotlib.pyplot as plt

Path = mpath.Path

fig, ax = plt.subplots()
pp1 = mpatches.PathPatch(
    Path([(0, 0), (1, 0), (1, 1), (0, 0)],
         [Path.MOVETO, Path.CURVE3,
          Path.CURVE3, Path.CLOSEPOLY]),
    fc ="none", transform = ax.transData)

ax.add_patch(pp1)
ax.plot([0.75], [0.25], "go-")

fig.suptitle('matplotlib.axes.Axes.add_patch() \
function Example\n\n', fontweight ="bold")
plt.show()
輸出:
相關用法
注:本文由純淨天空篩選整理自SHUBHAMSINGH10大神的英文原創作品 Matplotlib.axes.Axes.add_patch() in Python。非經特殊聲明,原始代碼版權歸原作者所有,本譯文未經允許或授權,請勿轉載或複製。