Matplotlib是Python中的一個庫,它是數字的-NumPy庫的數學擴展。軸類包含大多數圖形元素:Axis,Tick,Line2D,Text,Polygon等,並設置坐標係。 Axes實例通過callbacks屬性支持回調。
matplotlib.axes.Axes.add_collection()函數
matplotlib庫的axiss模塊中的Axes.add_collection()函數用於將Collection添加到軸的collection中;返回集合。
用法: Axes.add_collection(self, collection, autolim=True)
參數:此方法接受以下參數。
- collection:該參數是collection()函數產生的集合。
返回值:此方法返回集合。
以下示例說明了matplotlib.axes.Axes.add_collection()matplotlib.axes中的函數:
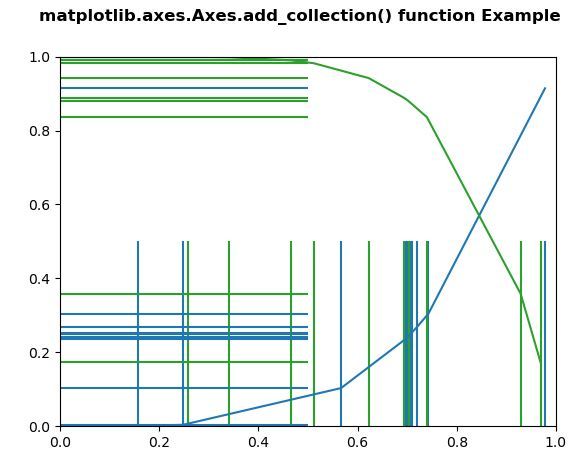
範例1:
# Implementation of matplotlib function
import matplotlib.pyplot as plt
from matplotlib.collections import EventCollection
import numpy as np

np.random.seed(19680801)
xvalue = np.random.random([2, 10])
xvalue1 = xvalue[0,:]
xvalue2 = xvalue[1,:]
xvalue1.sort()
xvalue2.sort()

yvalue1 = xvalue1 ** 4
yvalue2 = 1 - xvalue2 ** 6

fig = plt.figure()
ax = fig.add_subplot(1, 1, 1)
ax.plot(xvalue1, yvalue1, color ='tab:blue')
ax.plot(xvalue2, yvalue2, color ='tab:green')

xresult1 = EventCollection(xvalue1, color ='tab:blue')
xresult2 = EventCollection(xvalue2, color ='tab:green')
yresult1 = EventCollection(yvalue1, color ='tab:blue',
                           orientation ='vertical')
yresult2 = EventCollection(yvalue2, color ='tab:green',
                           orientation ='vertical')
ax.add_collection(xresult1)
ax.add_collection(xresult2)
ax.add_collection(yresult1)
ax.add_collection(yresult2)

ax.set_xlim([0, 1])
ax.set_ylim([0, 1])

fig.suptitle('matplotlib.axes.Axes.add_collection() \
function Example\n\n', fontweight ="bold")
plt.show()
輸出:
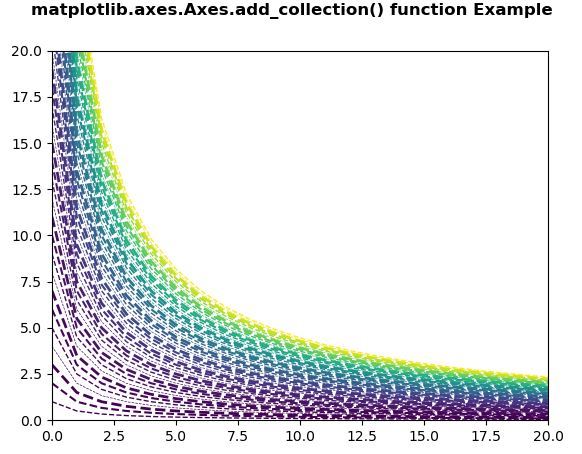
範例2:
# Implementation of matplotlib function
import matplotlib.pyplot as plt
from matplotlib.collections import LineCollection
from matplotlib import colors as mcolors
import numpy as np

N = 50
x = np.arange(N)

ys = [i/(x + 1) for i in x]

fig, ax = plt.subplots()
ax.set_xlim(0, 20)
ax.set_ylim(0, 20)

line_segments = LineCollection([np.column_stack([x, y]) for y in ys],
                               linewidths =(0.5, 1, 1.5, 2),
                               linestyles ='dashed',
                               color ="# eeffdd")
line_segments.set_array(x**2)
ax.add_collection(line_segments)

fig.suptitle('matplotlib.axes.Axes.add_collection()\
 function Example\n\n', fontweight ="bold")
plt.show()
輸出:
注:本文由純淨天空篩選整理自 Matplotlib.axes.Axes.add_collection() in Python。非經特殊聲明,原始代碼版權歸原作者所有,本譯文未經允許或授權,請勿轉載或複製。