Matplotlib是Python中的一個庫,它是數字的-NumPy庫的數學擴展。軸類包含大多數圖形元素:Axis,Tick,Line2D,Text,Polygon等,並設置坐標係。 Axes實例通過callbacks屬性支持回調。
matplotlib.axes.Axes.add_artist()函數
matplotlib庫的axiss模塊中的Axes.add_artist()函數用於將Artist添加到軸,然後返回Artist。
用法: Axes.add_artist(self, a)
參數:此方法接受以下參數。
- a:該參數是由legend()函數產生的圖例。
返回值:此方法返回藝術家。
以下示例說明了matplotlib.axes.Axes.add_artist()matplotlib.axes中的函數:
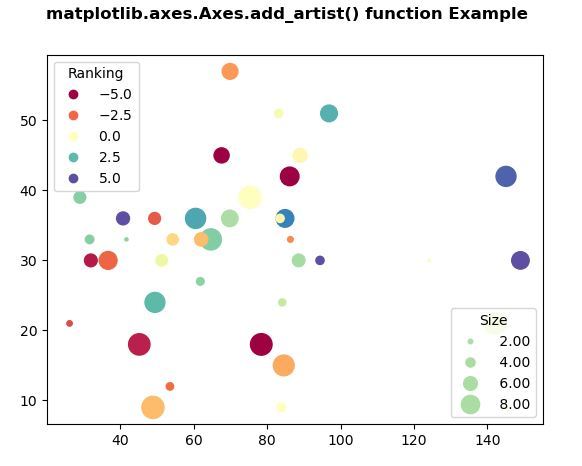
範例1:
# Implementation of matplotlib function
import numpy as np
np.random.seed(19680801)
import matplotlib.pyplot as plt

volume = np.random.rayleigh(27, size = 40)
amount = np.random.poisson(10, size = 40)
ranking = np.random.normal(size = 40)
price = np.random.uniform(1, 10, size = 40)

fig, ax = plt.subplots()

scatter = ax.scatter(volume * 2, amount * 3,
                     c = ranking * 3,
                     s = 0.3*(price * 3)**2,
                     vmin =-4, vmax = 4,
                     cmap ="Spectral")

legend1 = ax.legend(*scatter.legend_elements(num = 5),
                    loc ="upper left",
                    title ="Ranking")

ax.add_artist(legend1)

kw = dict(prop ="sizes", num = 5,
          color = scatter.cmap(0.7),
          fmt =" {x:.2f}",
          func = lambda s:np.sqrt(s/.3)/3)

legend2 = ax.legend(*scatter.legend_elements(**kw),
                    loc ="lower right",
                    title ="Size")

fig.suptitle('matplotlib.axes.Axes.add_artist() \
function Example\n\n', fontweight ="bold")
plt.show()
輸出:
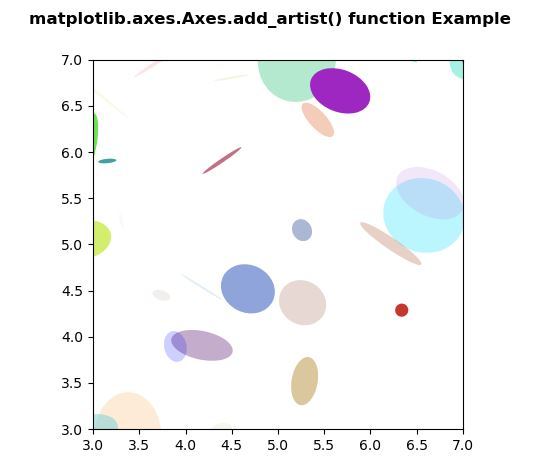
範例2:
# Implementation of matplotlib function
import matplotlib.pyplot as plt
import numpy as np
from matplotlib.patches import Ellipse

NUM = 200

ells = [Ellipse(xy = np.random.rand(2) * 10,
                width = np.random.rand(),
                height = np.random.rand(),
                angle = np.random.rand() * 360)
        for i in range(NUM)]

fig, ax = plt.subplots(subplot_kw ={'aspect':'equal'})

for e in ells:
    ax.add_artist(e)
    e.set_clip_box(ax.bbox)
    e.set_alpha(np.random.rand())
    e.set_facecolor(np.random.rand(4))

ax.set_xlim(3, 7)
ax.set_ylim(3, 7)


fig.suptitle('matplotlib.axes.Axes.add_artist() \
function Example\n\n', fontweight ="bold")

plt.show()
輸出:
相關用法
注:本文由純淨天空篩選整理自SHUBHAMSINGH10大神的英文原創作品 Matplotlib.axes.Axes.add_artist() in Python。非經特殊聲明,原始代碼版權歸原作者所有,本譯文未經允許或授權,請勿轉載或複製。