Matplotlib是Python中的一個庫,它是數字的-NumPy庫的數學擴展。的Artist類包含呈現對象的Abstract基類到一個FigureCanvas中。圖中所有可見元素都是Artist的子類。
Matplotlib.artist.Artist.set_transform()方法
matplotlib庫的藝術家模塊中的set_transform()方法用於設置藝術家變換。
用法:藝術家。set_transform(t)
參數:此方法僅接受一個參數。
- t:此參數是“變換”。
返回值:此方法不返回任何值。
以下示例說明了matplotlib.artist.Artist。set_transform()在matplotlib中的函數:
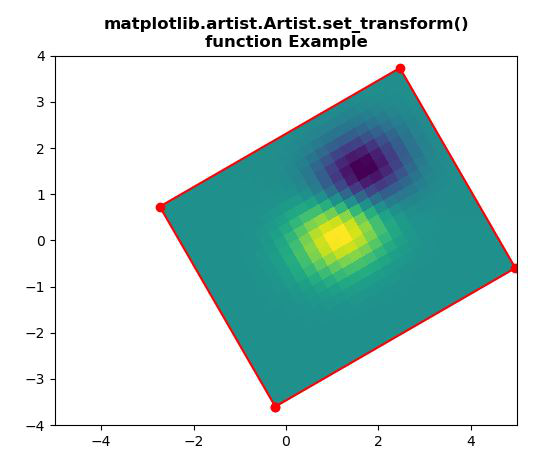
範例1:
# Implementation of matplotlib function
from matplotlib.artist import Artist
import numpy as np
import matplotlib.pyplot as plt
import matplotlib.transforms as mtransforms


delta = 0.25

x = y = np.arange(-3.0, 3.0, delta)
X, Y = np.meshgrid(x, y)

Z1 = np.exp(-X**2 - Y**2)
Z2 = np.exp(-(X - 1)**2 - (Y - 1)**2)
Z = (Z1 - Z2)

transform = mtransforms.Affine2D().rotate_deg(30)
fig, ax = plt.subplots()

im = ax.imshow(Z, interpolation ='none',
               origin ='lower',
               extent =[-2, 4, -3, 2],
               clip_on = True)

trans_data = transform + ax.transData
Artist.set_transform(im, trans_data)

x1, x2, y1, y2 = im.get_extent()
ax.plot([x1, x2, x2, x1, x1],
        [y1, y1, y2, y2, y1],
        "ro-",
        transform = trans_data)

ax.set_xlim(-5, 5)
ax.set_ylim(-4, 4)

plt.title("""matplotlib.artist.Artist.set_transform()
function Example""", fontweight="bold")

plt.show()
輸出:
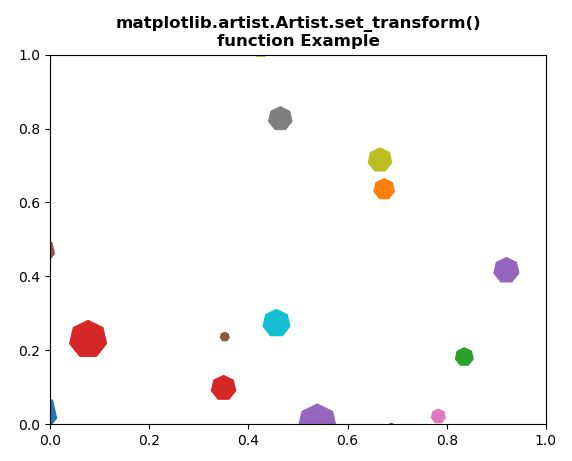
範例2:
# Implementation of matplotlib function
from matplotlib.artist import Artist
import matplotlib.pyplot as plt
from matplotlib import collections, colors, transforms
import numpy as np


nverts = 50
npts = 100

r = np.arange(nverts)
theta = np.linspace(0, 2 * np.pi, nverts)

xx = r * np.sin(theta)
yy = r * np.cos(theta)

spiral = np.column_stack([xx, yy])

rs = np.random.RandomState(19680801)

xyo = rs.randn(npts, 2)

colors = [colors.to_rgba(c)
          for c in plt.rcParams['axes.prop_cycle'].by_key()['color']]

fig, ax1 = plt.subplots()

col = collections.RegularPolyCollection(
    7, sizes = np.abs(xx) * 10.0,
    offsets = xyo,
    transOffset = ax1.transData)

trans = transforms.Affine2D().scale(fig.dpi / 72.0)
Artist.set_transform(col, trans)

ax1.add_collection(col, autolim = True)
col.set_color(colors)

plt.title("""matplotlib.artist.Artist.set_transform()
function Example""", fontweight="bold")

plt.show()
輸出:
相關用法
注:本文由純淨天空篩選整理自shivanisinghss2110大神的英文原創作品 Matplotlib.artist.Artist.set_transform() in Python。非經特殊聲明,原始代碼版權歸原作者所有,本譯文未經允許或授權,請勿轉載或複製。