Matplotlib是Python中的一個庫,它是數字的-NumPy庫的數學擴展。 Artist類包含用於呈現到FigureCanvas中的對象的Abstract基類。圖中所有可見元素都是Artist的子類。
matplotlib.artist.Artist.set()方法
matplotlib庫的藝術家模塊中的set()方法是屬性批處理設置程序。傳遞kwarg設置屬性。
用法:Artist.set(self, **kwargs)
參數:此方法不接受除** kwargs之外的任何參數。
返回:此方法不返回任何值。
以下示例說明了matplotlib中的matplotlib.artist.Artist.set()函數:
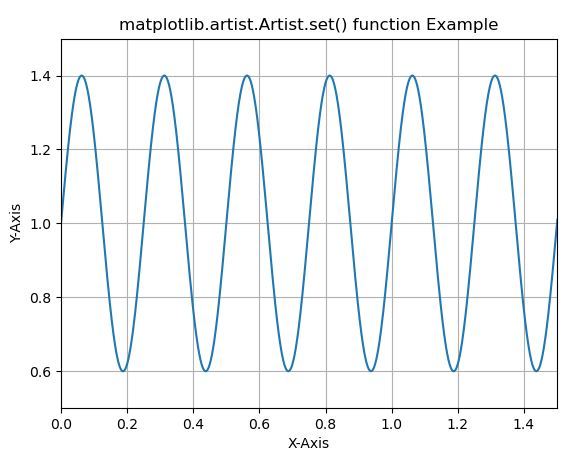
範例1:
# Implementation of matplotlib function
from matplotlib.artist import Artist
import matplotlib
import matplotlib.pyplot as plt
import numpy as np


t = np.arange(0.0, 2, 0.001)
s = 1 + np.sin(8 * np.pi * t)*0.4

fig, ax = plt.subplots()
ax.plot(t, s)

Artist.set(ax, xlabel ='X-Axis', ylabel ='Y-Axis',
    xlim =(0, 1.5), ylim =(0.5, 1.5),
    title ='matplotlib.artist.Artist.set() function Example')

ax.grid()

plt.show()
輸出:
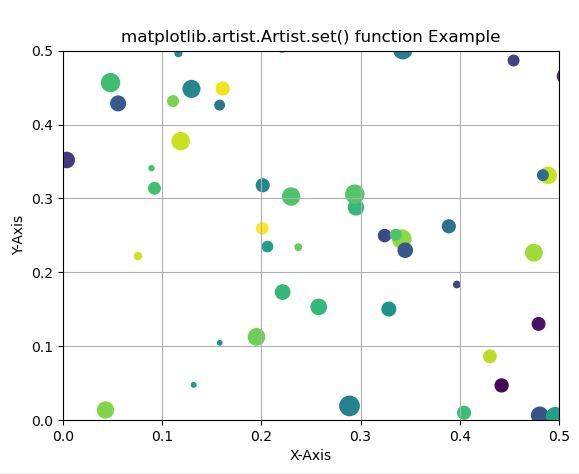
範例2:
# Implementation of matplotlib function
from matplotlib.artist import Artist
import numpy as np
import matplotlib.pyplot as plt
np.random.seed(19680801)


fig, ax = plt.subplots()

x, y, s, c = np.random.rand(4, 200)
s *= 200

ax.scatter(x, y, s, c)

Artist.set(ax, xlabel ='X-Axis', ylabel ='Y-Axis',
   xlim =(0, 0.5), ylim =(0, 0.5),
   title ='matplotlib.artist.Artist.set() function Example')

ax.grid()

plt.show()
輸出:
注:本文由純淨天空篩選整理自SHUBHAMSINGH10大神的英文原創作品 Matplotlib.artist.Artist.set() in Python。非經特殊聲明,原始代碼版權歸原作者所有,本譯文未經允許或授權,請勿轉載或複製。