Matplotlib是Python中的一個庫,它是數字的-NumPy庫的數學擴展。的Artist類包含呈現對象的Abstract基類到一個FigureCanvas中。圖中所有可見元素都是Artist的子類。
Matplotlib.artist.Artist.get_gid()方法
matplotlib庫的藝術家模塊中的get_gid()方法用於獲取組ID。
用法:藝術家.get_gid(self)
參數:此方法不接受任何參數。
返回值:此方法返回組ID。
以下示例說明了matplotlib.artist.Artist.get_gid()在matplotlib中的函數:
範例1:
# Implementation of matplotlib function
from matplotlib.artist import Artist
import numpy as np
import matplotlib.pyplot as plt


y, x = np.mgrid[:5, 1:6]

poly_coords = [
    (0.25, 2.75), (3.25, 2.75),
    (2.25, 0.75), (0.25, 0.75)
]

fig, ax = plt.subplots()

cells = ax.plot(x, y, x + y, color ='green')

ax.add_patch(
    plt.Polygon(poly_coords,
                color ='forestgreen',
                alpha = 0.5)
    )

ax.margins(x = 0.1, y = 0.05)
ax.set_aspect('equal')

for i, t in enumerate(ax.patches):
    Artist.set_gid(t, 'patch_% d' % i)
    print("Value Return:", Artist.get_gid(t))

fig.suptitle("""matplotlib.artist.Artist.get_gid()
function Example""", fontweight="bold")

plt.show()
輸出:
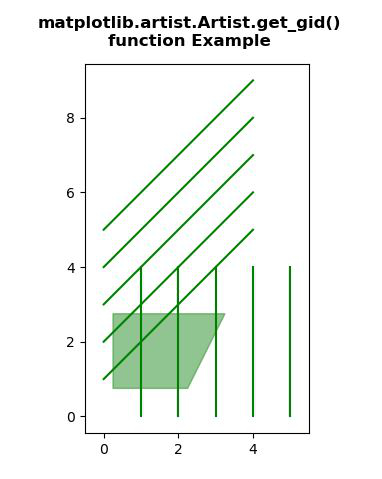
Value Return:patch_ 0
範例2:
# Implementation of matplotlib function
from matplotlib.artist import Artist
import numpy as np
import matplotlib.pyplot as plt


fig, ax = plt.subplots()

circle = plt.Circle((0, 0), 5, fc ='blue')
rect = plt.Rectangle((-5, 10), 10, 5, fc ='green')

ax.add_patch(circle)
ax.add_patch(rect)

circle_tip = ax.annotate('This is a blue circle.',
            xy =(0, 0),
            xytext =(30, -30),
            textcoords ='offset points',
            color ='w',
            ha ='left',
            bbox = dict(boxstyle ='round, pad =.5',
                        fc =(.1, .1, .1, .92),
                        ec =(1., 1., 1.),
                        lw = 1,
                        zorder = 1),
            )

rect_tip = ax.annotate('This is a green rectangle.',
            xy =(-5, 10),
            xytext =(30, 40),
            textcoords ='offset points',
            color ='w',
            ha ='left',
            bbox = dict(boxstyle ='round, pad =.5',
                        fc =(.1, .1, .1, .92),
                        ec =(1., 1., 1.),
                        lw = 1,
                        zorder = 1),
            )

print("Value Return:")
for i, t in enumerate(ax.patches):
    Artist.set_gid(t, 'patch_% d'% i)
    print(Artist.get_gid(t))

for i, t in enumerate(ax.texts):
    Artist.set_gid(t, 'tooltip_% d'% i)
    print(Artist.get_gid(t))

ax.set_xlim(-30, 30)
ax.set_ylim(-30, 30)
ax.set_aspect('equal')

fig.suptitle("""matplotlib.artist.Artist.get_gid()
function Example""", fontweight="bold")

plt.show()
輸出:
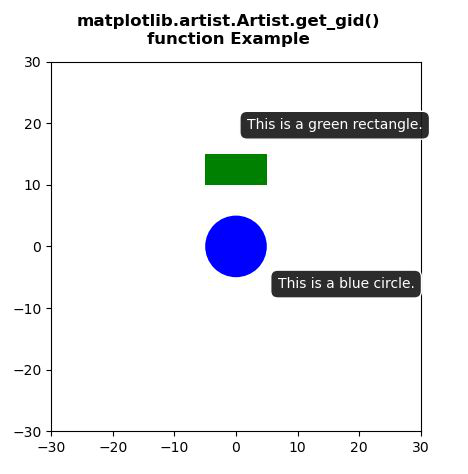
Value Return:
patch_ 0
patch_ 1
tooltip_ 0
tooltip_ 1
相關用法
注:本文由純淨天空篩選整理自shivanisinghss2110大神的英文原創作品 Matplotlib.artist.Artist.get_gid() in Python。非經特殊聲明,原始代碼版權歸原作者所有,本譯文未經允許或授權,請勿轉載或複製。