Matplotlib是Python中的一個庫,它是數字的-NumPy庫的數學擴展。 Artist類包含用於呈現到FigureCanvas中的對象的Abstract基類。圖中所有可見元素都是Artist的子類。
matplotlib.artist.Artist.get_animated()方法
matplotlib庫的藝術家模塊中的get_animated()方法用於獲取動畫狀態。
用法:Artist.get_animated(self)
參數:此方法不接受任何參數。
返回:此方法返回動畫狀態。
以下示例說明了matplotlib中的matplotlib.artist.Artist.get_animated()函數:
範例1:
# Implementation of matplotlib function
from matplotlib.artist import Artist
import numpy as np
import matplotlib.pyplot as plt
import matplotlib.animation as animation


data = np.array([[1, 2, 3, 4, 5],
                [7, 4, 9, 2, 3]])

fig = plt.figure()
ax = plt.axes(xlim =(0, 20), ylim =(0, 20))

line, = ax.plot([], [], 'r-')
annotation = ax.annotate('', xy =(data[0][0],
                         data[1][0]))

Artist.set_animated(annotation, True)
w = Artist.get_animated(annotation)

print(str(w))

fig.suptitle('matplotlib.artist.Artist.get_animated()\
function Example', fontweight ="bold")

ax.grid()

plt.show()
輸出:
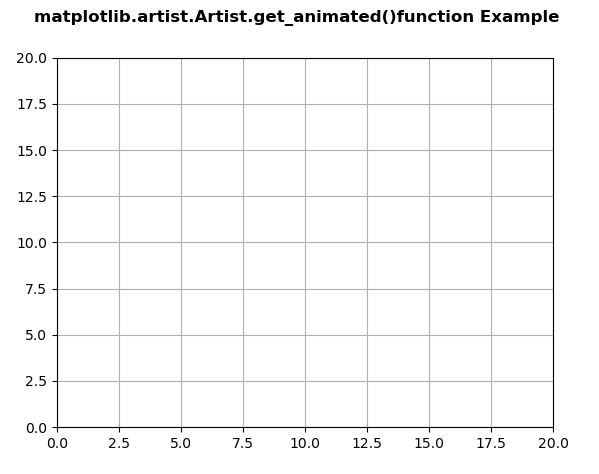
True
範例2:
# Implementation of matplotlib function
from matplotlib.artist import Artist
import numpy as np
import matplotlib.pyplot as plt
import matplotlib.animation as animation


fig, ax = plt.subplots()

ax.set_xlim([-1, 1])
ax.set_ylim([-1, 1])

L = 50
theta = np.linspace(0, 2 * np.pi, L)
r = np.ones_like(theta)

x = r * np.cos(theta)
y = r * np.sin(theta)

line, = ax.plot(1, 0, 'ro')

annotation = ax.annotate(
    'annotation', xy =(1, 0), xytext =(-1, 0),
    arrowprops = {'arrowstyle':"->"}
)
Artist.set_animated(annotation, False)
w = Artist.get_animated(annotation)

print(str(w))

fig.suptitle('matplotlib.artist.Artist.get_animated()\
function Example', fontweight ="bold")

ax.grid()

plt.show()
輸出:
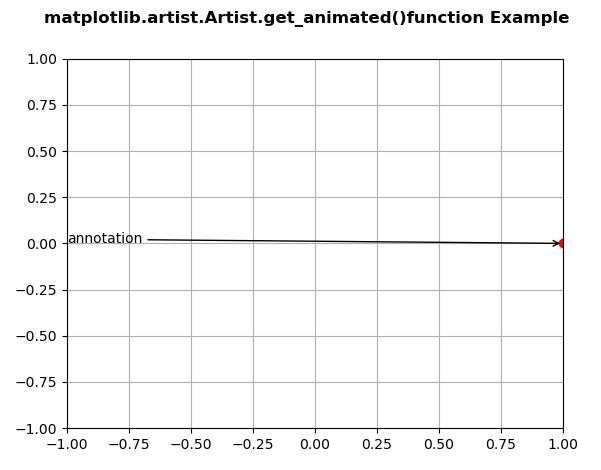
False
注:本文由純淨天空篩選整理自SHUBHAMSINGH10大神的英文原創作品 Matplotlib.artist.Artist.get_animated() in Python。非經特殊聲明,原始代碼版權歸原作者所有,本譯文未經允許或授權,請勿轉載或複製。