Matplotlib是Python中的一個庫,它是數字的-NumPy庫的數學擴展。 Artist類包含用於呈現到FigureCanvas中的對象的Abstract基類。圖中所有可見元素都是Artist的子類。
matplotlib.artist.Artist.get_alpha()方法
matplotlib庫的藝術家模塊中的get_alpha()方法用於獲取用於混合的alpha值。
用法:Artist.get_alpha(self)
參數:此方法不接受任何參數。
返回:此方法返回用於混合的Alpha值。
以下示例說明了matplotlib中的matplotlib.artist.Artist.get_alpha()函數:
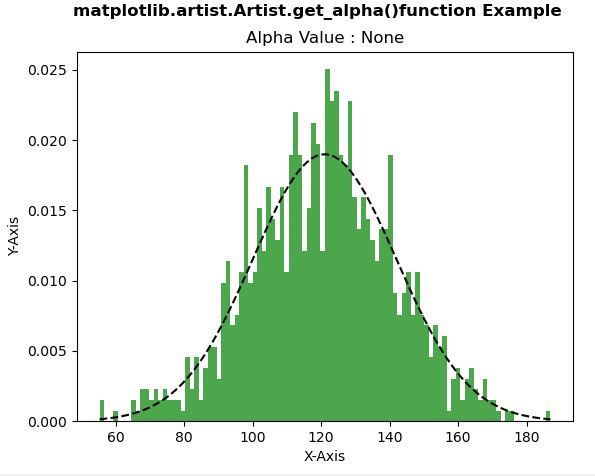
範例1:
# Implementation of matplotlib function
from matplotlib.artist import Artist
import matplotlib
import numpy as np
import matplotlib.pyplot as plt


np.random.seed(10**7)
mu = 121
sigma = 21
x = mu + sigma * np.random.randn(1000)

num_bins = 100
fig, ax = plt.subplots()

n, bins, patches = ax.hist(x, num_bins,
                           density = 1,
                           color ='green',
                           alpha = 0.7)

y = ((1 / (np.sqrt(2 * np.pi) * sigma)) *
     np.exp(-0.5 * (1 / sigma * (bins - mu))**2))

ax.plot(bins, y, '--', color ='black')

ax.set_xlabel('X-Axis')
ax.set_ylabel('Y-Axis')

w = Artist.get_alpha(ax)
ax.set_title("Alpha Value:"+str(w))

fig.suptitle('matplotlib.artist.Artist.get_alpha()\
function Example', fontweight ="bold")

plt.show()
輸出:
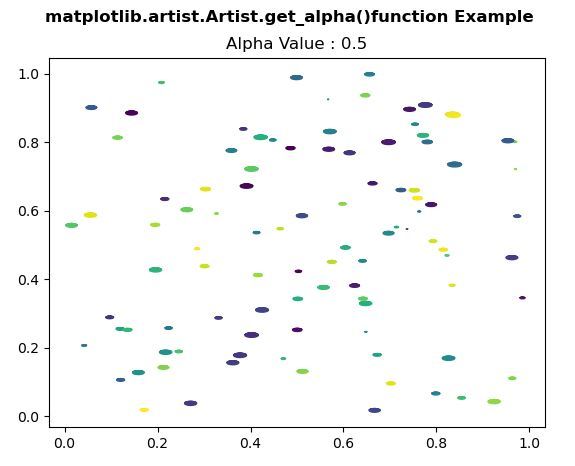
範例2:
# Implementation of matplotlib function
from matplotlib.artist import Artist
import matplotlib.pyplot as plt
import numpy as np


rx, ry = 3., 1.

value1 = rx * ry * np.pi
value2 = np.arange(0, 3 * np.pi + 0.01, 0.2)
value3 = np.column_stack([rx / value1 * np.cos(value2),
                          ry / value1 * np.sin(value2)])

x, y, s, c = np.random.rand(4, 99)
s *= 10**2.

fig, ax = plt.subplots()
ax.scatter(x, y, s, c, marker = value3)

Artist.set_alpha(ax, 0.5)

w = Artist.get_alpha(ax)
ax.set_title("Alpha Value:"+str(w))

fig.suptitle('matplotlib.artist.Artist.get_alpha()\
function Example', fontweight ="bold")

plt.show()
輸出:
相關用法
注:本文由純淨天空篩選整理自SHUBHAMSINGH10大神的英文原創作品 Matplotlib.artist.Artist.get_alpha() in Python。非經特殊聲明,原始代碼版權歸原作者所有,本譯文未經允許或授權,請勿轉載或複製。