Matplotlib是Python中的一個庫,它是數字的-NumPy庫的數學擴展。的Artist類包含呈現對象的Abstract基類到一個FigureCanvas中。圖中所有可見元素都是Artist的子類。
Matplotlib.artist.Artist.findobj()方法
matplotlib庫的藝術家模塊中的findobj()方法用於返回查找藝術家對象。
用法:Artist.findobj(self,match = None,include_self = True)
參數:此方法接受以下參數。
- match:此參數是匹配的過濾條件。默認值為無。
- include_self:此參數將self包含在要檢查是否匹配的列表中。
返回值:此方法返回藝術家(藝術家列表)。
以下示例說明了matplotlib.artist.Artist。findobj()在matplotlib中的函數:
範例1:
# Implementation of matplotlib function
from matplotlib.artist import Artist
import matplotlib.pyplot as plt
from matplotlib.lines import Line2D
import numpy as np
from numpy.random import rand


fig, ax2 = plt.subplots()

ax2.bar(range(10), rand(10), picker = True)

print("Value return:\n",
      *list(Artist.findobj(ax2)), sep ="\n")

plt.title("""matplotlib.artist.Artist.findobj()
function Example""", fontweight="bold")

plt.show()
輸出:
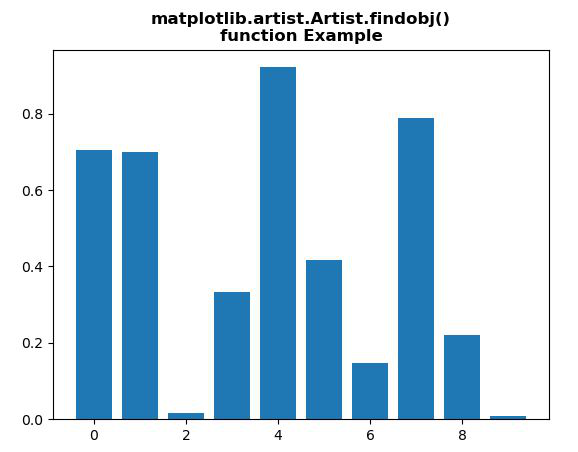
Value return:

Rectangle(xy=(-0.4, 0), width=0.8, height=0.705031, angle=0)
Rectangle(xy=(0.6, 0), width=0.8, height=0.698788, angle=0)
Rectangle(xy=(1.6, 0), width=0.8, height=0.0159568, angle=0)
Rectangle(xy=(2.6, 0), width=0.8, height=0.332931, angle=0)
Rectangle(xy=(3.6, 0), width=0.8, height=0.921611, angle=0)
Rectangle(xy=(4.6, 0), width=0.8, height=0.4171, angle=0)
Rectangle(xy=(5.6, 0), width=0.8, height=0.148145, angle=0)
Rectangle(xy=(6.6, 0), width=0.8, height=0.78801, angle=0)
Rectangle(xy=(7.6, 0), width=0.8, height=0.221423, angle=0)
Rectangle(xy=(8.6, 0), width=0.8, height=0.00829394, angle=0)
Spine
Spine
Spine
Spine
Text(0.5, 0, '')
Text(1, 0, '')
Line2D()
Line2D()
Line2D((0,0),(0,1))
Text(0, 0, '')
Text(0, 1, '')
<matplotlib.axis.XTick object at 0x07BE51D0>
Line2D()
Line2D()
Line2D((0,0),(0,1))
Text(0, 0, '')
Text(0, 1, '')
<matplotlib.axis.XTick object at 0x07BE51B0>
Line2D()
Line2D()
Line2D((0,0),(0,1))
Text(0, 0, '')
Text(0, 1, '')
<matplotlib.axis.XTick object at 0x0A589750>
Line2D()
Line2D()
Line2D((0,0),(0,1))
Text(0, 0, '')
Text(0, 1, '')
<matplotlib.axis.XTick object at 0x0A5A1C50>
Line2D()
Line2D()
Line2D((0,0),(0,1))
Text(0, 0, '')
Text(0, 1, '')
<matplotlib.axis.XTick object at 0x0A5A1B70>
Line2D()
Line2D()
Line2D((0,0),(0,1))
Text(0, 0, '')
Text(0, 1, '')
<matplotlib.axis.XTick object at 0x0A5B4170>
Line2D()
Line2D()
Line2D((0,0),(0,1))
Text(0, 0, '')
Text(0, 1, '')
<matplotlib.axis.XTick object at 0x0A5B4430>
XAxis(80.0,52.8)
Text(0, 0.5, '')
Text(0, 0.5, '')
Line2D()
Line2D()
Line2D((0,0),(1,0))
Text(0, 0, '')
Text(1, 0, '')
<matplotlib.axis.YTick object at 0x07BE58F0>
Line2D()
Line2D()
Line2D((0,0),(1,0))
Text(0, 0, '')
Text(1, 0, '')
<matplotlib.axis.YTick object at 0x07BE5570>
Line2D()
Line2D()
Line2D((0,0),(1,0))
Text(0, 0, '')
Text(1, 0, '')
<matplotlib.axis.YTick object at 0x0A5B4670>
Line2D()
Line2D()
Line2D((0,0),(1,0))
Text(0, 0, '')
Text(1, 0, '')
<matplotlib.axis.YTick object at 0x0A5B4AB0>
Line2D()
Line2D()
Line2D((0,0),(1,0))
Text(0, 0, '')
Text(1, 0, '')
<matplotlib.axis.YTick object at 0x0A5B4D90>
Line2D()
Line2D()
Line2D((0,0),(1,0))
Text(0, 0, '')
Text(1, 0, '')
<matplotlib.axis.YTick object at 0x0A5BE0F0>
YAxis(80.0,52.8)
Text(0.5, 1.0, '')
Text(0.0, 1.0, '')
Text(1.0, 1.0, '')
Rectangle(xy=(0, 0), width=1, height=1, angle=0)
AxesSubplot(0.125,0.11;0.775x0.77)
範例2:
# Implementation of matplotlib function
from matplotlib.artist import Artist
import numpy as np
import matplotlib.pyplot as plt
import matplotlib.patches as mpatches


fig, ax = plt.subplots()
x, y = 10 * np.random.rand(2, 1000)
ax.plot(x, y, 'go', alpha = 0.2)

circ = mpatches.Circle((0.5, 0.5), 0.25,
                       transform = ax.transAxes,
                       facecolor ='blue',
                       alpha = 0.75)
ax.add_patch(circ)

print("Value return:\n",
      *list(Artist.findobj(ax)), sep ="\n")

plt.title("""matplotlib.artist.Artist.findobj()
function Example""", fontweight="bold")

plt.show()
輸出:
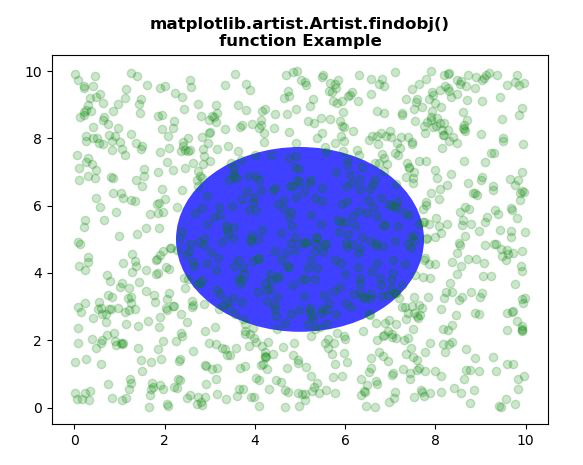
Value return:

Circle(xy=(0.5, 0.5), radius=0.25)
Line2D(_line0)
Spine
Spine
Spine
Spine
Text(0.5, 0, '')
Text(1, 0, '')
Line2D()
Line2D()
Line2D((0,0),(0,1))
Text(0, 0, '')
Text(0, 1, '')
<matplotlib.axis.XTick object at 0x085071F0>
Line2D()
Line2D()
Line2D((0,0),(0,1))
Text(0, 0, '')
Text(0, 1, '')
<matplotlib.axis.XTick object at 0x085071D0>
Line2D()
Line2D()
Line2D((0,0),(0,1))
Text(0, 0, '')
Text(0, 1, '')
<matplotlib.axis.XTick object at 0x0AE7ABF0>
Line2D()
Line2D()
Line2D((0,0),(0,1))
Text(0, 0, '')
Text(0, 1, '')
<matplotlib.axis.XTick object at 0x0AE7AD70>
Line2D()
Line2D()
Line2D((0,0),(0,1))
Text(0, 0, '')
Text(0, 1, '')
<matplotlib.axis.XTick object at 0x0AE920F0>
Line2D()
Line2D()
Line2D((0,0),(0,1))
Text(0, 0, '')
Text(0, 1, '')
<matplotlib.axis.XTick object at 0x0AE92390>
Line2D()
Line2D()
Line2D((0,0),(0,1))
Text(0, 0, '')
Text(0, 1, '')
<matplotlib.axis.XTick object at 0x0AE92650>
Line2D()
Line2D()
Line2D((0,0),(0,1))
Text(0, 0, '')
Text(0, 1, '')
<matplotlib.axis.XTick object at 0x0AE928F0>
XAxis(80.0,52.8)
Text(0, 0.5, '')
Text(0, 0.5, '')
Line2D()
Line2D()
Line2D((0,0),(1,0))
Text(0, 0, '')
Text(1, 0, '')
<matplotlib.axis.YTick object at 0x08507910>
Line2D()
Line2D()
Line2D((0,0),(1,0))
Text(0, 0, '')
Text(1, 0, '')
<matplotlib.axis.YTick object at 0x08507590>
Line2D()
Line2D()
Line2D((0,0),(1,0))
Text(0, 0, '')
Text(1, 0, '')
<matplotlib.axis.YTick object at 0x0AE92A90>
Line2D()
Line2D()
Line2D((0,0),(1,0))
Text(0, 0, '')
Text(1, 0, '')
<matplotlib.axis.YTick object at 0x0AE92DB0>
Line2D()
Line2D()
Line2D((0,0),(1,0))
Text(0, 0, '')
Text(1, 0, '')
<matplotlib.axis.YTick object at 0x0AE92FF0>
Line2D()
Line2D()
Line2D((0,0),(1,0))
Text(0, 0, '')
Text(1, 0, '')
<matplotlib.axis.YTick object at 0x0AE92B10>
Line2D()
Line2D()
Line2D((0,0),(1,0))
Text(0, 0, '')
Text(1, 0, '')
<matplotlib.axis.YTick object at 0x0AE7AC50>
Line2D()
Line2D()
Line2D((0,0),(1,0))
Text(0, 0, '')
Text(1, 0, '')
<matplotlib.axis.YTick object at 0x0AEA00F0>
YAxis(80.0,52.8)
Text(0.5, 1.0, '')
Text(0.0, 1.0, '')
Text(1.0, 1.0, '')
Rectangle(xy=(0, 0), width=1, height=1, angle=0)
AxesSubplot(0.125,0.11;0.775x0.77)
相關用法
注:本文由純淨天空篩選整理自shivanisinghss2110大神的英文原創作品 Matplotlib.artist.Artist.findobj() in Python。非經特殊聲明,原始代碼版權歸原作者所有,本譯文未經允許或授權,請勿轉載或複製。