voronoi.extent()函數用於設置Voronoi生成器函數的範圍。給定的範圍值用於在給定的邊界內設置Voronoi布局的裁剪範圍。邊界以二維數組形式給出,看起來像[[x0,y0],[x1,y1]]。如果未指定範圍,則它將返回其默認值為null的當前剪輯範圍。
用法:
d3.voronoi().extent([extent]);
參數:此函數采用上麵給出的和下麵描述的一個參數。
- extent:它告知要修剪的區域。它采用二維數組形式的值。
返回值:此函數不返回任何內容。
注意:請創建一個“data.csv”文件。該文件的數據在下麵的代碼中給出。
下麵給出了Voronoi.extent()函數的一些示例。
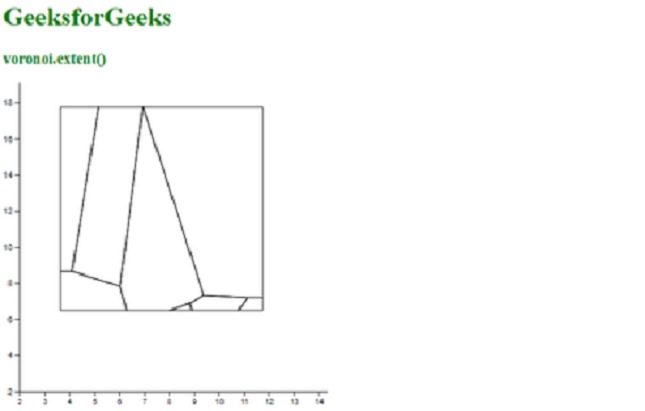
範例1:
HTML
<!DOCTYPE html>
<html lang="en">

<head>
    <meta charset="UTF-8">
    <meta name="viewport" content="
        width=device-width, initial-scale=1.0">

    <script type="text/javascript"
        src="https://d3js.org/d3.v4.min.js">
    </script>
    <script src="https://d3js.org/d3-voronoi.v1.min.js">
    </script>
</head>

<body>
    <h1 style="color:green">GeeksforGeeks</h1>
    <h3 style="color:green">voronoi.extent()</h3>

    <script>
        d3.csv("data.csv", function(error, data){
            var svg = d3.select("body")
                        .append("svg")
                        .attr("height", 400)
                        .attr("width", 400)
                        .append("g")
                        .attr("transform",
                     "translate(" + 20 + ", " + -20 + ")");

            var y = d3.scaleLinear()
                      .domain([2, 20])
                      .range([400, 0]);
            var x = d3.scaleLinear()
                      .domain([2, 15])
                      .range([0, 400]);
            svg.append("g")
                    .call(d3.axisLeft(y));

            svg.append("g")
                    .attr("transform",
                     "translate(0, " + 400 + ")")
                    .call(d3.axisBottom(x));
            var voronoi = d3.voronoi()
                        .x(function(d) { return x(d.x); });
                  voronoi.y(function(d) { return y(d.y); })
                // Setting the extent using voronoi.extent()
                .extent([[50, 50], [300, 300]]);

            svg.append("g").selectAll("path")
                .data(voronoi(data).polygons())
                .enter()
                .append("path")
                .attr("d", (d)=>{ return d ?
                ("M" + d.join("L") + "Z"):null; })
                .attr("fill", "none")
                .attr("stroke", "black");
        });

        // Data for CSV file
        // x, y, group
        // 45, 4.4, H
        // 9.1, 4.4, H
        // 9.9, 9.9, H
        // 4.45, 9.6, H
        // 4, 7.6, H
        // 9, 45, H
        // 4, 9.7, H
        // 9.7, 4.7, H
        // 9.9, 4.5, H
        // 4, 4.5, H
        // 7.9, 9, H
        // 9.9, 45, H
        // 9, 4.4, H
    </script>
</body>
</html>
輸出:
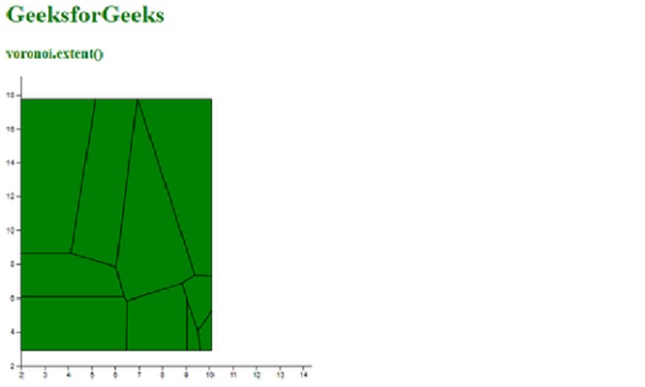
範例2:
HTML
<!DOCTYPE html>
<html lang="en">

<head>
    <meta charset="UTF-8">
    <meta name="viewport" content="
        width=device-width, initial-scale=1.0">

    <script type="text/javascript"
        src="https://d3js.org/d3.v4.min.js">
    </script>
    <script src="https://d3js.org/d3-voronoi.v1.min.js">
    </script>
</head>

<body>
    <h1 style="color:green">GeeksforGeeks</h1>
    <h3 style="color:green">voronoi.extent()</h3>

    <script>
        d3.csv("data.csv", function(error, data){
            var svg = d3.select("body")
                        .append("svg")
                        .attr("height", 400)
                        .attr("width", 400)
                        .append("g")
                        .attr("transform", "translate
                        (" + 20 + ", " + -20 + ")");

            var y = d3.scaleLinear()
                      .domain([2, 20])
                      .range([400, 0]);
            var x = d3.scaleLinear()
                      .domain([2, 15])
                      .range([0, 400]);
            svg.append("g")
                    .call(d3.axisLeft(y));

            svg.append("g")
                    .attr("transform", "translate(0, " + 400 + ")")
                    .call(d3.axisBottom(x));


            var voronoi = d3.voronoi()
                            .x(function(d) { return x(d.x); });
                voronoi.y(function(d) { return y(d.y); })
                // Setting the extent using voronoi.extent() function
                .extent([[0, 50], [250, 380]]);

            svg.append("g").selectAll("path")
                .data(voronoi(data).polygons())
                .enter()
                .append("path")
                .attr("d", (d)=>{ return d ? ("M" + d.join("L") + "Z"):null; })
                .attr("fill", "green")
                .attr("stroke", "black");
        });

        // Data for CSV file
        // x, y, group
        // 45, 4.4, H
        // 9.1, 4.4, H
        // 9.9, 9.9, H
        // 4.45, 9.6, H
        // 4, 7.6, H
        // 9, 45, H
        // 4, 9.7, H
        // 9.7, 4.7, H
        // 9.9, 4.5, H
        // 4, 4.5, H
        // 7.9, 9, H
        // 9.9, 45, H
        // 9, 4.4, H
    </script>
</body>
</html>
輸出:
相關用法
- PHP imagecreatetruecolor()用法及代碼示例
- p5.js year()用法及代碼示例
- d3.js d3.utcTuesdays()用法及代碼示例
- PHP ImagickDraw getTextAlignment()用法及代碼示例
- PHP Ds\Sequence last()用法及代碼示例
- PHP array_udiff_uassoc()用法及代碼示例
- PHP geoip_continent_code_by_name()用法及代碼示例
- d3.js d3.map.set()用法及代碼示例
- PHP GmagickPixel setcolor()用法及代碼示例
- PHP opendir()用法及代碼示例
- PHP cal_to_jd()用法及代碼示例
- d3.js d3.bisectLeft()用法及代碼示例
- PHP stream_get_transports()用法及代碼示例
- PHP Ds\Deque pop()用法及代碼示例
注:本文由純淨天空篩選整理自tarun007大神的英文原創作品 D3.js voronoi.extent() Function。非經特殊聲明,原始代碼版權歸原作者所有,本譯文未經允許或授權,請勿轉載或複製。