pie.value()函數用於設置餅圖生成器函數返回的數據的value屬性。如果指定了值,則它將值設置為給定的動態或靜態函數或數字。
用法:
pie.value([value]);
參數:該函數接受如上所述和以下描述的單個參數。
- value:該參數采用一個函數或一個數字。
返回值:此函數不返回任何內容。
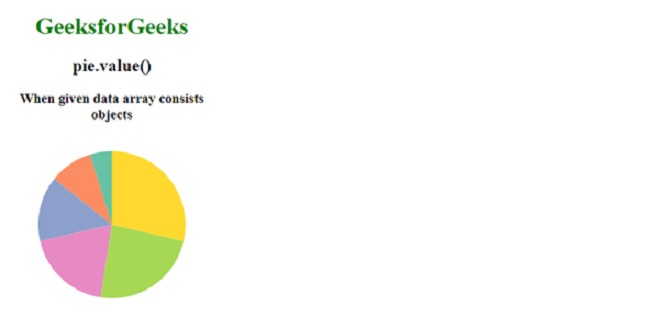
範例1:
HTML
<!DOCTYPE html>
<html lang="en">

<head>
    <meta charset="UTF-8" />
    <meta property="viewport" content=
        "width=device-width,initial-scale=1.0"/>

    <!--Fetching from CDN of D3.js -->
    <script src="https://d3js.org/d3.v6.min.js">
    </script>
</head>

<body>
    <div style="width:300px; height:300px;">
        <center>
            <h1 style="color:green">
                GeeksforGeeks
            </h1>
            <h2>
                pie.value()
            </h2>
            <h3>
                When given data array
                consists objects
            </h3>
        </center>
        <svg width="300" height="300">
        </svg>
    </div>

    <script>
        // Data to be added in the pie chart
        var data = [
            { "value":1, "property":"p1" },
            { "value":2, "property":"p2" },
            { "value":3, "property":"p3" },
            { "value":4, "property":"p4" },
            { "value":5, "property":"p5" },
            { "value":6, "property":"p6" }
        ]

        // Selecting SVG using d3.select()
        var svg = d3.select("svg");

        // Creating Pie generator
        var pie = d3.pie()
            // Use of pie.value() Function
            .value((d) => { return d.value });

        // Creating arc
        var arc = d3.arc()
            .innerRadius(0)
            .outerRadius(100);

        let g = svg.append("g")
            .attr("transform", "translate(150, 120)");

        // Grouping different arcs
        var arcs = g.selectAll("arc")
            .data(pie(data))
            .enter()
            .append("g");

        // Appending path
        arcs.append("path")
            .attr("fill", (data, i) => {
                return d3.schemeSet2[i];
            })
            .attr("d", arc);
    </script>
</body>

</html>
輸出:
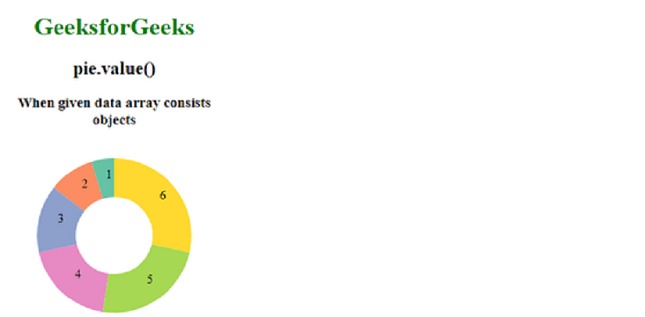
範例2:
HTML
<!DOCTYPE html>
<html lang="en">

<head>
    <meta charset="UTF-8" />
    <meta property="viewport" content=
        "width=device-width, initial-scale=1.0"/>
    <!--Fetching from CDN of D3.js -->
    <script src="https://d3js.org/d3.v6.min.js">
    </script>
</head>

<body>
    <div style="width:300px; height:300px;">
        <center>
            <h1 style="color:green">
                GeeksforGeeks
            </h1>
            <h2>
                pie.value()
            </h2>
            <h3>
                When given data array
                consists objects
            </h3>
        </center>
        <svg width="300" height="300">
        </svg>
    </div>
    <script>
        // Data to be added in the pie chart
        var data = [
            { "value":1, "property":"p1" },
            { "value":2, "property":"p2" },
            { "value":3, "property":"p3" },
            { "value":4, "property":"p4" },
            { "value":5, "property":"p5" },
            { "value":6, "property":"p6" }
        ]

        // Selecting SVG using d3.select()
        var svg = d3.select("svg");

        // Creating Pie generator
        var pie = d3.pie()
            // Use of pie.value() Function
            .value((d) => { return d.value })
            (data);

        // Creating arc
        var arc = d3.arc()
            .innerRadius(50)
            .outerRadius(100);

        let g = svg.append("g")
            .attr("transform", "translate(150, 120)");

        // Grouping different arcs
        var arcs = g.selectAll("arc")
            .data(pie)
            .enter()
            .append("g");

        // Appending path
        arcs.append("path")
            .attr("fill", (data, i) => {
                return d3.schemeSet2[i];
            })
            .attr("d", arc);

        arcs.append("text")
            .attr("transform", (d) => {
                return "translate(" +
                    arc.centroid(d) + ")";
            })
            .text(function (d) {
                return d.value;
            });
    </script>
</body>

</html>
輸出:
相關用法
- PHP imagecreatetruecolor()用法及代碼示例
- p5.js year()用法及代碼示例
- d3.js d3.utcTuesdays()用法及代碼示例
- PHP ImagickDraw getTextAlignment()用法及代碼示例
- PHP Ds\Sequence last()用法及代碼示例
- PHP array_udiff_uassoc()用法及代碼示例
- PHP geoip_continent_code_by_name()用法及代碼示例
- d3.js d3.map.set()用法及代碼示例
- PHP GmagickPixel setcolor()用法及代碼示例
- PHP opendir()用法及代碼示例
- PHP cal_to_jd()用法及代碼示例
- d3.js d3.bisectLeft()用法及代碼示例
- PHP stream_get_transports()用法及代碼示例
- PHP Ds\Deque pop()用法及代碼示例
注:本文由純淨天空篩選整理自tarun007大神的英文原創作品 D3.js pie.value() Function。非經特殊聲明,原始代碼版權歸原作者所有,本譯文未經允許或授權,請勿轉載或複製。