JavaScript D3.js庫使用HTML5,可縮放矢量圖形和級聯樣式表為網頁提供交互式數據可視化。 d3.js中的geoMtFlatPolarSinusoidal()函數用於繪製McBryde-Thomas flat-polar正弦equal-area投影。
用法:
d3.geoMtFlatPolarSinusoidal()
參數:此方法不接受任何參數。
返回值:此方法根據給定的JSON數據創建McBryde-Thomas flat-polar正弦equal-area投影。
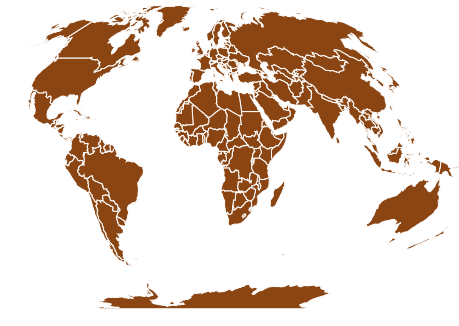
範例1:下麵的示例創建MtFlatPolarSinusoidal世界投影,其中心位於(0,0)且不旋轉。
HTML
<!DOCTYPE html>
<html lang="en">

<head>
    <meta charset="UTF-8" />
    <meta name="viewport" content=
        "width=device-width, initial-scale=1.0" />
    <script src="https://d3js.org/d3.v4.js"></script>
    <script src=
"https://d3js.org/d3-geo-projection.v2.min.js">
    </script>
</head>

<body>
    <div style="width:700px; height:500px;">
        <svg width="600" height="450"></svg>
    </div>

    <script>
        var svg = d3.select("svg"),
            width = +svg.attr("width"),
            height = +svg.attr("height");

        // MtFlatPolarSinusoidal projection
        // Center(0,0) with 0 rotation
        var gfg = d3.geoMtFlatPolarSinusoidal()
            .scale(width / 1.8 / Math.PI)
            .rotate([0, 0])
            .center([0, 0])
            .translate([width / 2, height / 2])

        // Loading the json data
        // Used json file stored at
        // https://raw.githubusercontent.com/janasayantan
        // /datageojson/master/world.json
        d3.json("https://raw.githubusercontent.com/"
            + "janasayantan/datageojson/master/world.json",
            function (data) {

                // Drawing the map
                svg.append("g")
                    .selectAll("path")
                    .data(data.features)
                    .enter().append("path")
                    .attr("fill", "SaddleBrown")
                    .attr("d", d3.geoPath()
                        .projection(gfg)
                    )
                    .style("stroke", "#ffff")
            })
    </script>
</body>

</html>
輸出:
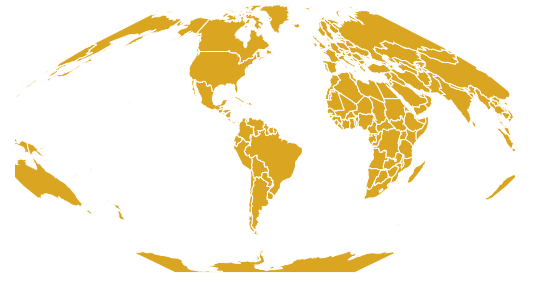
範例2:在下麵的示例中,我們將創建MtFlatPolarSinusoidal世界投影,其中心位於(0,10),並且相對於Y軸旋轉60度。
HTML
<!DOCTYPE html>
<html lang="en">

<head>
    <meta charset="UTF-8" />
    <meta name="viewport" content=
        "width=device-width, initial-scale=1.0" />
    <script src="https://d3js.org/d3.v4.js"></script>
    <script src=
"https://d3js.org/d3-geo-projection.v2.min.js">
    </script>
</head>

<body>
    <div style="width:700px; height:600px;">
        <svg width="500" height="450"></svg>
    </div>

    <script>
        var svg = d3.select("svg"),
            width = +svg.attr("width"),
            height = +svg.attr("height");

        // MtFlatPolarSinusoidal  projection
        // Center(0,10) and 60 degree
        // rotation w.r.t Y axis
        var gfg = d3.geoMtFlatPolarSinusoidal()
            .scale(width / 1.7 / Math.PI)
            .rotate([60, 0])
            .center([0, 10])
            .translate([width / 2, height / 2])

        // Loading the json data
        // Used json file stored at
        // https://raw.githubusercontent.com/janasayantan
        // /datageojson/master/world.json
        d3.json("https://raw.githubusercontent.com/"
            + "janasayantan/datageojson/master/world.json",
            function (data) {

                // Draw the map
                svg.append("g")
                    .selectAll("path")
                    .data(data.features)
                    .enter().append("path")
                    .attr("fill", "GoldenRod")
                    .attr("d", d3.geoPath()
                        .projection(gfg)
                    )
                    .style("stroke", "#ffff")
            })
    </script>
</body>

</html>
輸出:
相關用法
- PHP imagecreatetruecolor()用法及代碼示例
- p5.js year()用法及代碼示例
- d3.js d3.utcTuesdays()用法及代碼示例
- PHP ImagickDraw getTextAlignment()用法及代碼示例
- PHP Ds\Sequence last()用法及代碼示例
- PHP array_udiff_uassoc()用法及代碼示例
- PHP geoip_continent_code_by_name()用法及代碼示例
- d3.js d3.map.set()用法及代碼示例
- PHP GmagickPixel setcolor()用法及代碼示例
- PHP opendir()用法及代碼示例
- PHP cal_to_jd()用法及代碼示例
- d3.js d3.bisectLeft()用法及代碼示例
- PHP stream_get_transports()用法及代碼示例
- PHP Ds\Deque pop()用法及代碼示例
注:本文由純淨天空篩選整理自jana_sayantan大神的英文原創作品 D3.js geoMtFlatPolarSinusoidal() Function。非經特殊聲明,原始代碼版權歸原作者所有,本譯文未經允許或授權,請勿轉載或複製。