density.bandwidth()函數用於設置密度估計器函數的帶寬。如果未指定帶寬,則它將設置等於20.4939的默認帶寬。如果指定了帶寬,則它將設置高斯內核的帶寬並返回估計值。
用法:
d3.contourDensity.x().y().bandwidth([bandwidth]);
參數:此函數采用上麵給出的和下麵描述的一個參數。
- bandwidth:該函數采用一個數字,該數字定義了密度估計器函數的帶寬。
返回值:此函數不返回任何內容。
下麵給出了一些density.bandwidth()函數的示例。
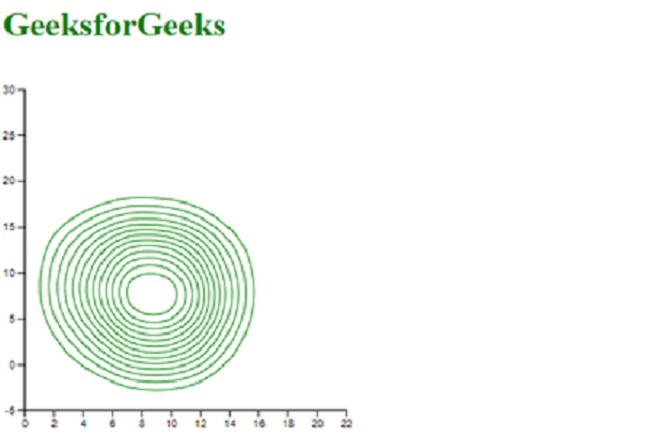
範例1:
HTML
<!DOCTYPE html>
<html lang="en">

<head>
    <meta charset="UTF-8">
    <meta name="viewport" content="
        width=device-width, initial-scale=1.0">

    <script type="text/javascript"
        src="https://d3js.org/d3.v4.min.js">
    </script>
    <script src="https://d3js.org/d3-contour.v1.min.js">
    </script>
</head>

<body>
    <h1 style="color:green">GeeksforGeeks</h1>

    <script>
        // append the svg object to the body.
        var svg = d3.select("body")
        .append("svg")
            .attr("width", 500)
            .attr("height", 500)
        .append("g")
            .attr("transform",
                "translate(" + 20 + ", " + -80 + ")");

        // read data
        d3.csv("./data.csv", function(data) {

        var y = d3.scaleLinear()
            .domain([-5, 30])
            .range([ 400, 100 ]);

        var x = d3.scaleLinear()
            .domain([0, 22])
            .range([ 0, 300]);


        svg.append("g")
        .call(d3.axisLeft(y));

        svg.append("g")
            .attr("transform", "translate(0, " + 400 + ")")
            .call(d3.axisBottom(x));

        var density= d3.contourDensity()
            .y(function(d) { return y(d.y); })
            .x(function(d) { return x(d.x); })
            // Use of bandwidth() Function
            .bandwidth(40)
            (data)

        svg.selectAll("path")
            .data(density)
            .enter()
            .append("path")
            .attr("d", d3.geoPath())
            .attr("fill", "none")
            .attr("stroke", "green")
        });

        // Data for csv file
        // x, y, group
        // 9.45, 4.4, H
        // 9.1, 4.4, H
        // 9.9, 9.9, H
        // 9.6, 4.5, H
        // 9.1, 9.7, H
        // 4.7, 9.5, H
        // 7.9, 9.6, H
        // 4.7, 9.7, H
        // 9.45, 4.4, H
        // 12.1, 9.4, H
        // 7.5, 9, H
        // 4.5, 4.5, H
        // 9.45, 9.7, H
        // 4.45, 9.6, H
        // 9.5, 7.6, H
        // 9, 9.45, H
        // 4.7, 12, H
        // 9.7, 9.7, H
        // 9.6, 9, H
        // 12, 9, H
        // 9.45, 4.5, H
        // 9.9, 4.6, H
        // 12.7, 9.9, H
        // 9, 12.4, H
        // 9, 4.9, H
        // 9.5, 9.7, H
        // 9.7, 4.7, H
        // 9.9, 4.5, H
        // 4, 4.5, H
        // 7.9, 9, H
        // 9.9, 9.45, H
        // 9, 4.4, H
        // 4.7, 9.7, H
        // 4.5, 9.9, H
    </script>
</body>
</html>
輸出:
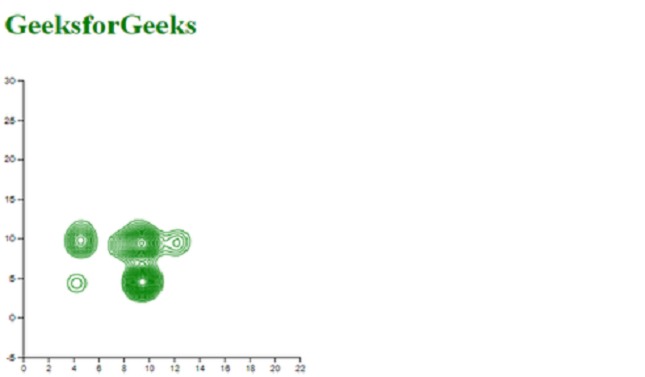
範例2:
HTML
<!DOCTYPE html>
<html lang="en">

<head>
    <meta charset="UTF-8">
    <meta name="viewport" content="
        width=device-width, initial-scale=1.0">

    <script type="text/javascript"
        src="https://d3js.org/d3.v4.min.js">
    </script>
    <script src="https://d3js.org/d3-contour.v1.min.js">
    </script>
</head>

<body>
    <h1 style="color:green">GeeksforGeeks</h1>

    <script>

        // append the svg object to the body.
        var svg = d3.select("body")
        .append("svg")
            .attr("width", 500)
            .attr("height", 500)
        .append("g")
            .attr("transform",
                "translate(" + 20 + ", " + -80 + ")");

        // read data
        d3.csv("./data.csv", function(data) {

        var y = d3.scaleLinear()
            .domain([-5, 30])
            .range([ 400, 100 ]);

        var x = d3.scaleLinear()
            .domain([0, 22])
            .range([ 0, 300]);


        svg.append("g")
        .call(d3.axisLeft(y));

        svg.append("g")
            .attr("transform", "translate(0, " + 400 + ")")
            .call(d3.axisBottom(x));

        var density= d3.contourDensity()
            .y(function(d) { return y(d.y); })
            .x(function(d) { return x(d.x); })
            // Use of bandwidth() Function
            .bandwidth(10)
            (data)

        svg.selectAll("path")
            .data(density)
            .enter()
            .append("path")
            .attr("d", d3.geoPath())
            .attr("fill", "none")
            .attr("stroke", "green")
        });

        // Data for csv file
        // x, y, group
        // 9.45, 4.4, H
        // 9.1, 4.4, H
        // 9.9, 9.9, H
        // 9.6, 4.5, H
        // 9.1, 9.7, H
        // 4.7, 9.5, H
        // 7.9, 9.6, H
        // 4.7, 9.7, H
        // 9.45, 4.4, H
        // 12.1, 9.4, H
        // 7.5, 9, H
        // 4.5, 4.5, H
        // 9.45, 9.7, H
        // 4.45, 9.6, H
        // 9.5, 7.6, H
        // 9, 9.45, H
        // 4.7, 12, H
        // 9.7, 9.7, H
        // 9.6, 9, H
        // 12, 9, H
        // 9.45, 4.5, H
        // 9.9, 4.6, H
        // 12.7, 9.9, H
        // 9, 12.4, H
        // 9, 4.9, H
        // 9.5, 9.7, H
        // 9.7, 4.7, H
        // 9.9, 4.5, H
        // 4, 4.5, H
        // 7.9, 9, H
        // 9.9, 9.45, H
        // 9, 4.4, H
        // 4.7, 9.7, H
        // 4.5, 9.9, H
    </script>
</body>
</html>
輸出:
相關用法
- PHP imagecreatetruecolor()用法及代碼示例
- p5.js year()用法及代碼示例
- d3.js d3.utcTuesdays()用法及代碼示例
- PHP ImagickDraw getTextAlignment()用法及代碼示例
- PHP Ds\Sequence last()用法及代碼示例
- PHP array_udiff_uassoc()用法及代碼示例
- PHP geoip_continent_code_by_name()用法及代碼示例
- d3.js d3.map.set()用法及代碼示例
- PHP GmagickPixel setcolor()用法及代碼示例
- PHP opendir()用法及代碼示例
- PHP cal_to_jd()用法及代碼示例
- d3.js d3.bisectLeft()用法及代碼示例
- PHP stream_get_transports()用法及代碼示例
- PHP Ds\Deque pop()用法及代碼示例
注:本文由純淨天空篩選整理自tarun007大神的英文原創作品 D3.js density.bandwidth() Function。非經特殊聲明,原始代碼版權歸原作者所有,本譯文未經允許或授權,請勿轉載或複製。