這個d3.curveMonotoneX內插器假設根據x坐標對數據進行排序,否則對數據進行相應的排序。假定x為單調性,此曲線方法將生成一個三次樣條,該樣條可保持y的單調性。
用法:
d3.curveMonotoneX()
參數:此方法不接受任何參數。
返回值:此方法不返回任何值。
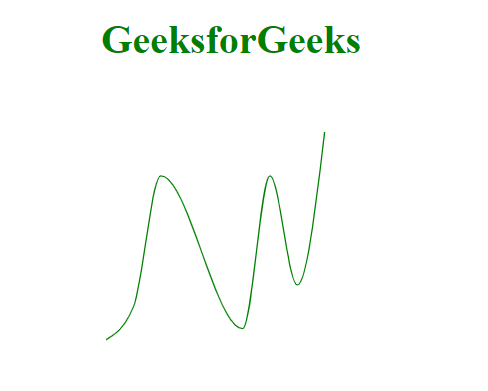
範例1:
<!DOCTYPE html>
<html>

<head>
    <meta charset="utf-8">
    <script src=
"https://cdnjs.cloudflare.com/ajax/libs/d3/4.2.2/d3.min.js">
    </script>
</head>

<body>
    <h1 style="text-align:center; color:green;">
        GeeksforGeeks
    </h1>

    <center>
        <svg id="gfg" width="250" height="250"></svg>
    </center>

    <script>
        var data = [
          {x:0, y:0},
          {x:1, y:3},
          {x:2, y:15},
          {x:5, y:1},
          {x:6, y:15},
          {x:7, y:5},
          {x:8, y:19}];

        var xScale = d3.scaleLinear()
          .domain([0, 8]).range([25, 200]);
        var yScale = d3.scaleLinear()
          .domain([0, 20]).range([200, 25]);

        var line = d3.line()
          .x((d) => xScale(d.x))
          .y((d) => yScale(d.y))
          .curve(d3.curveMonotoneX);

        d3.select("#gfg")
          .append("path")
          .attr("d", line(data))
          .attr("fill", "none")
          .attr("stroke", "green");
    </script>
</body>
</html>
輸出:
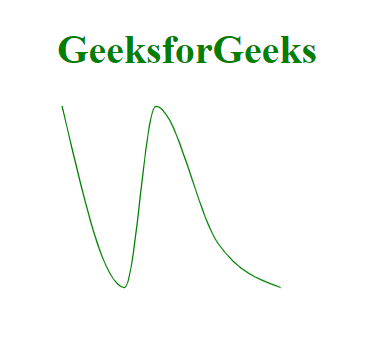
範例2:通過x軸對未排序的點進行排序,然後繪製曲線。
<!DOCTYPE html>
<html>

<head>
    <meta charset="utf-8">
    <script src=
"https://cdnjs.cloudflare.com/ajax/libs/d3/4.2.2/d3.min.js">
    </script>
</head>

<body>
    <h1 style="text-align:center; color:green;">
        GeeksforGeeks
    </h1>

    <center>
        <svg id="gfg" width="250" height="200"></svg>
    </center>

    <script>
        var points = [
          {xpoint:75,  ypoint:150},
          {xpoint:25,  ypoint:5},
          {xpoint:150, ypoint:115},
          {xpoint:100, ypoint:5},
          {xpoint:200, ypoint:150}];

        // Sorting the points by x axis
        points.sort((a, b) => a.xpoint - b.xpoint);

        var Gen = d3.line()
          .x((p) => p.xpoint)
          .y((p) => p.ypoint)
          .curve(d3.curveMonotoneX);

        d3.select("#gfg")
          .append("path")
          .attr("d", Gen(points))
          .attr("fill", "none")
          .attr("stroke", "green");

    </script>
</body>
</html>
輸出:
相關用法
- Lodash _.method()用法及代碼示例
- Javascript dataView.getInt16()用法及代碼示例
- Javascript RegExp toString()用法及代碼示例
- Node.js URLSearchParams.has()用法及代碼示例
- JavaScript Math cosh()用法及代碼示例
- HTML DOM isEqualNode()用法及代碼示例
- JavaScript Date toLocaleTimeString()用法及代碼示例
- Node.js crypto.createHash()用法及代碼示例
- Node.js writeStream.clearLine()用法及代碼示例
- Javascript Number isSafeInteger()用法及代碼示例
- HTML DOM History go()用法及代碼示例
- Node.js fs.link()用法及代碼示例
- JavaScript Math random()用法及代碼示例
- JavaScript Math round()用法及代碼示例
- Javascript toString()用法及代碼示例
- Javascript Number.isInteger( )用法及代碼示例
- Javascript Number.isFinite()用法及代碼示例
- Javascript toFixed()用法及代碼示例
注:本文由純淨天空篩選整理自taran910大神的英文原創作品 D3.js curveMonotoneX() Method。非經特殊聲明,原始代碼版權歸原作者所有,本譯文未經允許或授權,請勿轉載或複製。