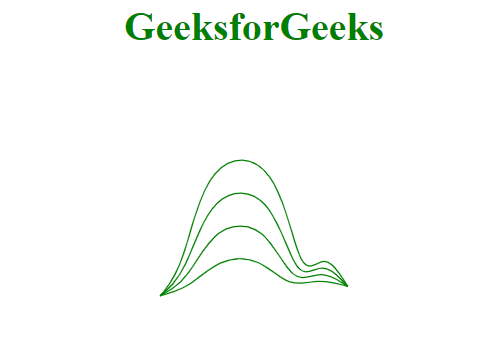
束曲線插值器創建拉直的cubic基礎花鍵。花鍵的拉直程度取決於插值器的貝塔值。一個有效的貝塔 值範圍介於0和1之間。Beta值是1曲線類似於由d3.curveBasis,測試版是0曲線是第一個和最後一個控製點之間的直線。
用法:
d3.curveBundle.beta(beta_value)
Parameters:
- beta_value:曲線的Beta值範圍為[0,1]
返回值:此方法不返回任何值。
範例1:
HTML
<!DOCTYPE html>
<html>
<meta charset="utf-8">

<head>
    <script src=
"https://cdnjs.cloudflare.com/ajax/libs/d3/4.2.2/d3.min.js">
    </script>
</head>

<body>
    <h1 style="text-align:center; color:green;">
        GeeksforGeeks
    </h1>
    <center>
        <svg id="gfg" width="200" height="200"></svg>
    </center>

    <script>
        var data = [
            { x:0, y:0 },
            { x:1, y:3 },
            { x:2, y:15 },
            { x:5, y:15 },
            { x:6, y:1 },
            { x:7, y:5 },
            { x:8, y:1 }];

        var xScale = d3.scaleLinear()
            .domain([0, 8]).range([25, 175]);
        var yScale = d3.scaleLinear()
            .domain([0, 20]).range([175, 25]);

        var line = d3.line()
            .x((d) => xScale(d.x))
            .y((d) => yScale(d.y))
            .curve(d3.curveBundle.beta(.25));

        var line1 = d3.line()
            .x((d) => xScale(d.x))
            .y((d) => yScale(d.y))
            .curve(d3.curveBundle.beta(.5));

        var line2 = d3.line()
            .x((d) => xScale(d.x))
            .y((d) => yScale(d.y))
            .curve(d3.curveBundle.beta(.75));

        var line3 = d3.line()
            .x((d) => xScale(d.x))
            .y((d) => yScale(d.y))
            .curve(d3.curveBundle.beta(1));

        d3.select("#gfg")
            .append("path")
            .attr("d", line(data))
            .attr("fill", "none")
            .attr("stroke", "green");

        d3.select("#gfg")
            .append("path")
            .attr("d", line1(data))
            .attr("fill", "none")
            .attr("stroke", "green");

        d3.select("#gfg")
            .append("path")
            .attr("d", line2(data))
            .attr("fill", "none")
            .attr("stroke", "green");

        d3.select("#gfg")
            .append("path")
            .attr("d", line3(data))
            .attr("fill", "none")
            .attr("stroke", "green");
    </script>
</body>

</html>
輸出:
範例2:
HTML
<!DOCTYPE html>
<html>
<meta charset="utf-8">

<head>
    <script src=
"https://cdnjs.cloudflare.com/ajax/libs/d3/4.2.2/d3.min.js">
    </script>
</head>

<body>
    <h1 style="text-align:center; color:green;">
        GeeksforGeeks
    </h1>
    <center>
        <svg id="gfg" width="200" height="200"></svg>
    </center>

    <script>
        var points = [
            { xpoint:25, ypoint:150 },
            { xpoint:75, ypoint:85 },
            { xpoint:100, ypoint:115 },
            { xpoint:175, ypoint:25 },
            { xpoint:200, ypoint:150 }];

        var Gen = d3.line()
            .x((p) => p.xpoint)
            .y((p) => p.ypoint)
            .curve(d3.curveBundle.beta(.25));

        var Gen1 = d3.line()
            .x((p) => p.xpoint)
            .y((p) => p.ypoint)
            .curve(d3.curveBundle.beta(.5));

        var Gen2 = d3.line()
            .x((p) => p.xpoint)
            .y((p) => p.ypoint)
            .curve(d3.curveBundle.beta(.75));

        var Gen3 = d3.line()
            .x((p) => p.xpoint)
            .y((p) => p.ypoint)
            .curve(d3.curveBundle.beta(1));

        d3.select("#gfg")
            .append("path")
            .attr("d", Gen(points))
            .attr("fill", "none")
            .attr("stroke", "green");

        d3.select("#gfg")
            .append("path")
            .attr("d", Gen1(points))
            .attr("fill", "none")
            .attr("stroke", "green");

        d3.select("#gfg")
            .append("path")
            .attr("d", Gen2(points))
            .attr("fill", "none")
            .attr("stroke", "green");

        d3.select("#gfg")
            .append("path")
            .attr("d", Gen3(points))
            .attr("fill", "none")
            .attr("stroke", "green");
    </script>
</body>

</html>
輸出:
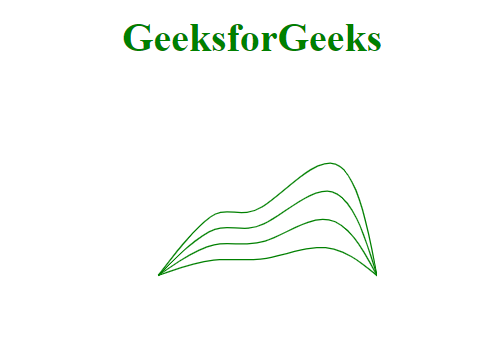
相關用法
- Lodash _.method()用法及代碼示例
- Javascript dataView.getInt16()用法及代碼示例
- Javascript RegExp toString()用法及代碼示例
- Node.js URLSearchParams.has()用法及代碼示例
- JavaScript Math cosh()用法及代碼示例
- HTML DOM isEqualNode()用法及代碼示例
- JavaScript Date toLocaleTimeString()用法及代碼示例
- Node.js crypto.createHash()用法及代碼示例
- Node.js writeStream.clearLine()用法及代碼示例
- Javascript Number isSafeInteger()用法及代碼示例
- HTML DOM History go()用法及代碼示例
- Node.js fs.link()用法及代碼示例
- JavaScript Math random()用法及代碼示例
- JavaScript Math round()用法及代碼示例
- Javascript toString()用法及代碼示例
- Javascript Number.isInteger( )用法及代碼示例
- Javascript Number.isFinite()用法及代碼示例
- Javascript toFixed()用法及代碼示例
注:本文由純淨天空篩選整理自taran910大神的英文原創作品 D3.js curveBundle.beta() Method。非經特殊聲明,原始代碼版權歸原作者所有,本譯文未經允許或授權,請勿轉載或複製。