D3.js中的chord.sortGroups()函數用於將組比較器設置為指定函數或為null,並返回此和弦布局。
用法:
chord.sortGroups( [compare] )
參數:該函數接受如上所述和以下描述的單個參數
- compare:該參數是設置組比較器的函數。
返回值:此函數返回和弦布局。
以下示例程序旨在說明D3.js中的chord.sortGroups()函數:
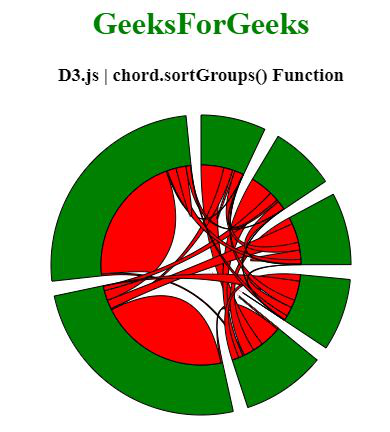
範例1:
HTML
<!DOCTYPE html>
<html>

<head>
    <script src="https://d3js.org/d3.v4.min.js">
    </script>
</head>

<body>
    <center>
        <h1 style="color:green;">GeeksForGeeks</h1>

        <h3>D3.js | chord.sortGroups() Function</h3>
        <div id="GFG"></div>

        <script>
            // Create the svg area
            var svg = d3.select("#GFG")
                .append("svg")
                .attr("width", 320)
                .attr("height", 320)
                .append("g")
                .attr("transform", "translate(160,160)")

            // Create input data
            var data = [[10, 161, 80, 80, 12, 34, 53],
            [13, 990, 9, 69, 76, 35, 4],
            [175, 71, 16, 68, 0, 0, 3],
            [51, 148, 60, 71, 34, 5, 1],
            [13, 990, 9, 69, 76, 35, 4],
            [175, 71, 16, 68, 0, 0, 3],
            [51, 148, 60, 71, 34, 5, 1]];

            // Give this matrix to d3.chord()
            var chords = d3.chord()
                .padAngle(0.1)

                // Use of chord.sortGroups() Function
                .sortGroups(d3.ascending)
                (data)

            svg.datum(chords)
                .append("g")
                .selectAll("g")
                .data(function (d) { return d.groups; })
                .enter()
                .append("g")
                .append("path")
                .style("fill", "green")
                .style("stroke", "black")
                .attr("d", d3.arc()
                    .innerRadius(100)
                    .outerRadius(150)
                )

            svg.datum(chords)
                .append("g")
                .selectAll("path")
                .data(function (d) { return d; })
                .enter()
                .append("path")
                .attr("d", d3.ribbon()
                    .radius(100)
                )
                .style("fill", "red")
                .style("stroke", "black");
        </script>
    </center>
</body>

</html>
輸出:
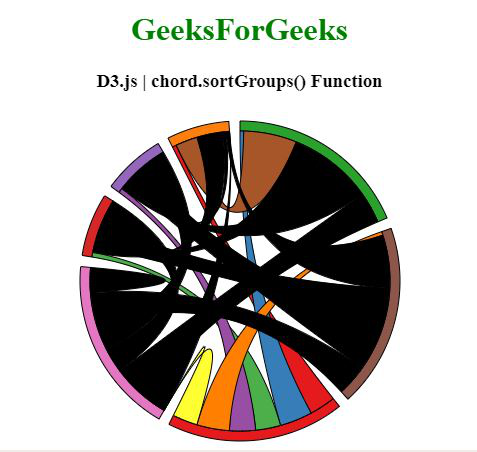
範例2:
HTML
<!DOCTYPE html>
<html>

<head>
    <script src="https://d3js.org/d3.v4.min.js">
    </script>
    <script src=
        "https://d3js.org/d3-color.v1.min.js">
    </script>
    <script src=
    "https://d3js.org/d3-interpolate.v1.min.js">
    </script>
    <script src=
    "https://d3js.org/d3-scale-chromatic.v1.min.js">
    </script>
</head>

<body>
    <center>
        <h1 style="color:green;">GeeksForGeeks</h1>

        <h3>D3.js | chord.sortGroups() Function</h3>
        <div id="GFG"></div>

        <script>

            // Create the svg area
            var svg = d3.select("#GFG")
                .append("svg")
                .attr("width", 340)
                .attr("height", 340)
                .append("g")
                .attr("transform", "translate(170,170)")

            // Create input data
            var data = [[0, 71, 89, 68, 71, 89, 68],
            [11, 0, 60, 71, 9, 9, 0],
            [10, 145, 0, 85, 145, 0, 85],
            [13, 9, 9, 0, 0, 60, 71],
            [13, 9, 9, 0, 0, 60, 71],
            [10, 145, 0, 85, 145, 0, 85],
            [0, 71, 89, 68, 71, 89, 68]];

            // 4 groups, so create a vector
            // of 4 colors
            var colors = [d3.schemeSet1[0],
                d3.schemeCategory10[1],
                d3.schemeCategory10[2],
                d3.schemeCategory10[3],
                d3.schemeCategory10[4],
                d3.schemeCategory10[5],
                d3.schemeCategory10[6]];

            var colors_1 = [d3.schemeSet1[0],
                d3.schemeSet1[1],
                d3.schemeSet1[2],
                d3.schemeSet1[3],
                d3.schemeSet1[4],
                d3.schemeSet1[5],
                d3.schemeSet1[6]];

            // Give this matrix to d3.chord()
            var chords = d3.chord()
                .padAngle(0.07)

                // Use of chord.sortGroups() Function
                .sortGroups(d3.descending)
                (data)

            svg.datum(chords)
                .append("g")
                .selectAll("g")
                .data(function (d) { return d.groups; })
                .enter()
                .append("g")
                .append("path")
                .style("fill", function (d, i) {
                    return colors[i]
                })
                .style("stroke", "black")
                .attr("d", d3.arc()
                    .innerRadius(150)
                    .outerRadius(160)
                )

            svg.datum(chords)
                .append("g")
                .selectAll("path")
                .data(function (d) { return d; })
                .enter()
                .append("path")
                .attr("d", d3.ribbon()
                    .radius(150)
                )
                .style("fill", function (d, i) {
                    return colors_1[i]
                })
                .style("stroke", "black");
        </script>
    </center>
</body>

</html>
輸出:
相關用法
- PHP Ds\Set add()用法及代碼示例
- PHP each()用法及代碼示例
- PHP Ds\Map put()用法及代碼示例
- PHP Ds\Set first()用法及代碼示例
- PHP Ds\Set last()用法及代碼示例
- d3.js d3.map.set()用法及代碼示例
- p5.js pan()用法及代碼示例
- p5.js value()用法及代碼示例
- PHP Ds\Map xor()用法及代碼示例
- PHP Ds\Set contains()用法及代碼示例
- PHP Ds\Set xor()用法及代碼示例
- d3.js lch()用法及代碼示例
- d3.js d3.max()用法及代碼示例
- p5.js hue()用法及代碼示例
- p5.js min()用法及代碼示例
- p5.js red()用法及代碼示例
注:本文由純淨天空篩選整理自SHUBHAMSINGH10大神的英文原創作品 D3.js chord.sortGroups() Function。非經特殊聲明,原始代碼版權歸原作者所有,本譯文未經允許或授權,請勿轉載或複製。